Apache vs Syrian Master's Degree
COMPARE
Apache
Syrian
Master's Degree
Master's Degree Comparison
Apache
Syrians
11.0%
MASTER'S DEGREE
0.0/ 100
METRIC RATING
315th/ 347
METRIC RANK
16.8%
MASTER'S DEGREE
98.3/ 100
METRIC RATING
105th/ 347
METRIC RANK
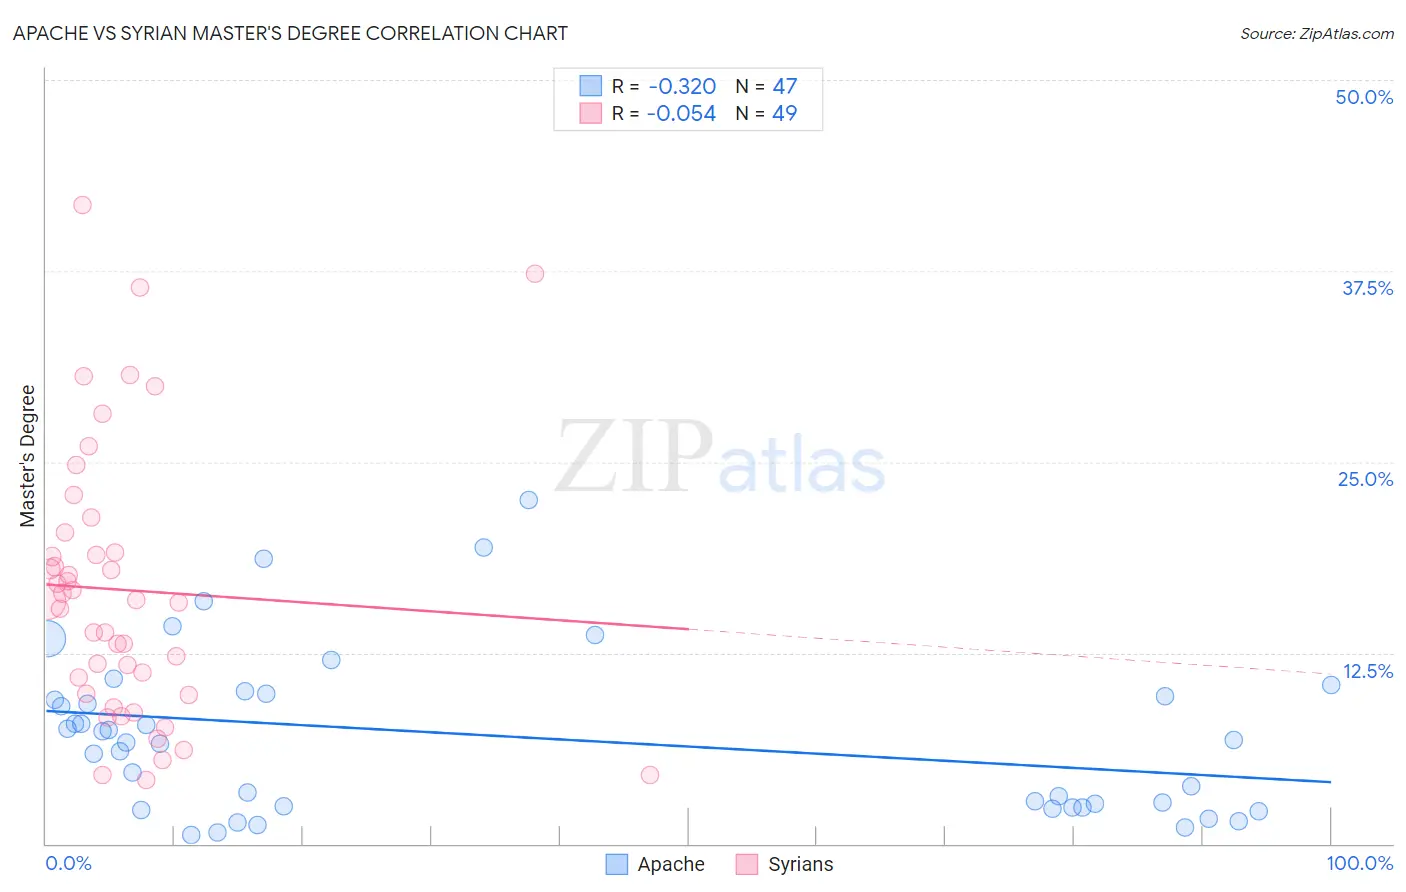
Apache vs Syrian Master's Degree Correlation Chart
The statistical analysis conducted on geographies consisting of 231,057,413 people shows a mild negative correlation between the proportion of Apache and percentage of population with at least master's degree education in the United States with a correlation coefficient (R) of -0.320 and weighted average of 11.0%. Similarly, the statistical analysis conducted on geographies consisting of 266,236,356 people shows a slight negative correlation between the proportion of Syrians and percentage of population with at least master's degree education in the United States with a correlation coefficient (R) of -0.054 and weighted average of 16.8%, a difference of 53.6%.
Master's Degree Correlation Summary
| Measurement | Apache | Syrian |
| Minimum | 0.59% | 4.2% |
| Maximum | 22.5% | 41.8% |
| Range | 21.9% | 37.6% |
| Mean | 7.0% | 16.6% |
| Median | 6.7% | 15.9% |
| Interquartile 25% (IQ1) | 2.3% | 9.8% |
| Interquartile 75% (IQ3) | 9.8% | 19.7% |
| Interquartile Range (IQR) | 7.4% | 9.9% |
| Standard Deviation (Sample) | 5.3% | 8.9% |
| Standard Deviation (Population) | 5.3% | 8.8% |
Similar Demographics by Master's Degree
Demographics Similar to Apache by Master's Degree
In terms of master's degree, the demographic groups most similar to Apache are Cajun (11.0%, a difference of 0.0%), Hispanic or Latino (10.9%, a difference of 0.34%), Yaqui (11.0%, a difference of 0.40%), Choctaw (11.0%, a difference of 0.58%), and Seminole (11.0%, a difference of 0.67%).
| Demographics | Rating | Rank | Master's Degree |
| Puerto Ricans | 0.0 /100 | #308 | Tragic 11.2% |
| Puget Sound Salish | 0.0 /100 | #309 | Tragic 11.1% |
| Shoshone | 0.0 /100 | #310 | Tragic 11.1% |
| Seminole | 0.0 /100 | #311 | Tragic 11.0% |
| Choctaw | 0.0 /100 | #312 | Tragic 11.0% |
| Yaqui | 0.0 /100 | #313 | Tragic 11.0% |
| Cajuns | 0.0 /100 | #314 | Tragic 11.0% |
| Apache | 0.0 /100 | #315 | Tragic 11.0% |
| Hispanics or Latinos | 0.0 /100 | #316 | Tragic 10.9% |
| Hopi | 0.0 /100 | #317 | Tragic 10.9% |
| Immigrants | Cuba | 0.0 /100 | #318 | Tragic 10.9% |
| Kiowa | 0.0 /100 | #319 | Tragic 10.8% |
| Immigrants | Micronesia | 0.0 /100 | #320 | Tragic 10.8% |
| Pennsylvania Germans | 0.0 /100 | #321 | Tragic 10.7% |
| Sioux | 0.0 /100 | #322 | Tragic 10.7% |
Demographics Similar to Syrians by Master's Degree
In terms of master's degree, the demographic groups most similar to Syrians are Ukrainian (16.9%, a difference of 0.10%), Alsatian (16.9%, a difference of 0.22%), Immigrants from Albania (16.8%, a difference of 0.28%), Armenian (16.8%, a difference of 0.37%), and Sierra Leonean (16.8%, a difference of 0.40%).
| Demographics | Rating | Rank | Master's Degree |
| Immigrants | Ukraine | 98.8 /100 | #98 | Exceptional 17.0% |
| Laotians | 98.8 /100 | #99 | Exceptional 17.0% |
| Albanians | 98.7 /100 | #100 | Exceptional 17.0% |
| Immigrants | Nepal | 98.6 /100 | #101 | Exceptional 17.0% |
| Chileans | 98.6 /100 | #102 | Exceptional 16.9% |
| Alsatians | 98.4 /100 | #103 | Exceptional 16.9% |
| Ukrainians | 98.3 /100 | #104 | Exceptional 16.9% |
| Syrians | 98.3 /100 | #105 | Exceptional 16.8% |
| Immigrants | Albania | 98.1 /100 | #106 | Exceptional 16.8% |
| Armenians | 98.0 /100 | #107 | Exceptional 16.8% |
| Sierra Leoneans | 98.0 /100 | #108 | Exceptional 16.8% |
| Moroccans | 98.0 /100 | #109 | Exceptional 16.8% |
| Immigrants | Chile | 98.0 /100 | #110 | Exceptional 16.8% |
| Austrians | 97.8 /100 | #111 | Exceptional 16.7% |
| Macedonians | 97.7 /100 | #112 | Exceptional 16.7% |