Apache vs French Canadian Master's Degree
COMPARE
Apache
French Canadian
Master's Degree
Master's Degree Comparison
Apache
French Canadians
11.0%
MASTER'S DEGREE
0.0/ 100
METRIC RATING
315th/ 347
METRIC RANK
14.1%
MASTER'S DEGREE
14.9/ 100
METRIC RATING
218th/ 347
METRIC RANK
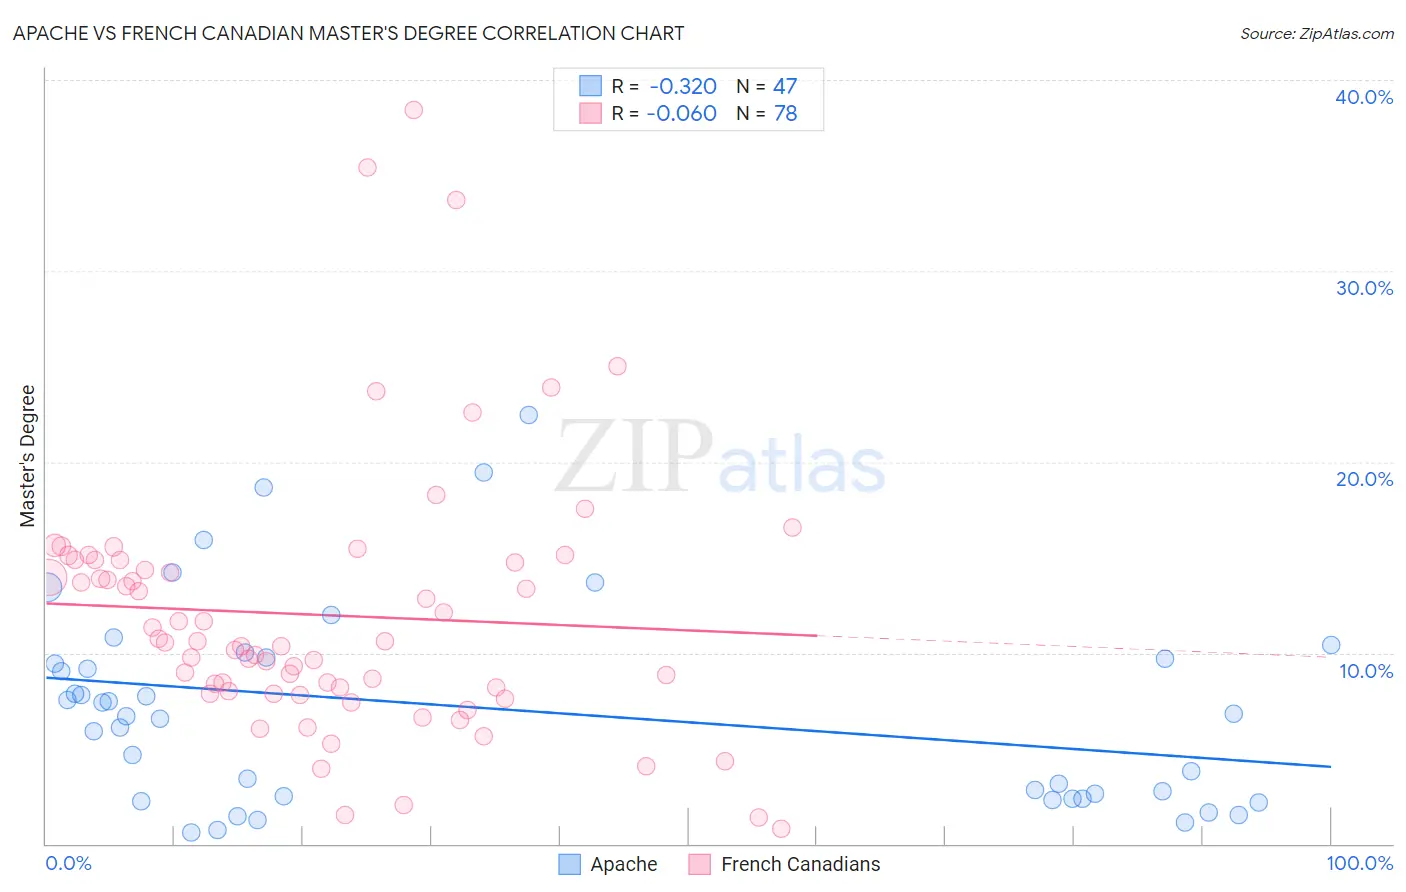
Apache vs French Canadian Master's Degree Correlation Chart
The statistical analysis conducted on geographies consisting of 231,057,413 people shows a mild negative correlation between the proportion of Apache and percentage of population with at least master's degree education in the United States with a correlation coefficient (R) of -0.320 and weighted average of 11.0%. Similarly, the statistical analysis conducted on geographies consisting of 502,359,495 people shows a slight negative correlation between the proportion of French Canadians and percentage of population with at least master's degree education in the United States with a correlation coefficient (R) of -0.060 and weighted average of 14.1%, a difference of 28.5%.
Master's Degree Correlation Summary
| Measurement | Apache | French Canadian |
| Minimum | 0.59% | 0.81% |
| Maximum | 22.5% | 38.5% |
| Range | 21.9% | 37.6% |
| Mean | 7.0% | 12.0% |
| Median | 6.7% | 10.6% |
| Interquartile 25% (IQ1) | 2.3% | 8.0% |
| Interquartile 75% (IQ3) | 9.8% | 14.9% |
| Interquartile Range (IQR) | 7.4% | 6.9% |
| Standard Deviation (Sample) | 5.3% | 6.9% |
| Standard Deviation (Population) | 5.3% | 6.9% |
Similar Demographics by Master's Degree
Demographics Similar to Apache by Master's Degree
In terms of master's degree, the demographic groups most similar to Apache are Cajun (11.0%, a difference of 0.0%), Hispanic or Latino (10.9%, a difference of 0.34%), Yaqui (11.0%, a difference of 0.40%), Choctaw (11.0%, a difference of 0.58%), and Seminole (11.0%, a difference of 0.67%).
| Demographics | Rating | Rank | Master's Degree |
| Puerto Ricans | 0.0 /100 | #308 | Tragic 11.2% |
| Puget Sound Salish | 0.0 /100 | #309 | Tragic 11.1% |
| Shoshone | 0.0 /100 | #310 | Tragic 11.1% |
| Seminole | 0.0 /100 | #311 | Tragic 11.0% |
| Choctaw | 0.0 /100 | #312 | Tragic 11.0% |
| Yaqui | 0.0 /100 | #313 | Tragic 11.0% |
| Cajuns | 0.0 /100 | #314 | Tragic 11.0% |
| Apache | 0.0 /100 | #315 | Tragic 11.0% |
| Hispanics or Latinos | 0.0 /100 | #316 | Tragic 10.9% |
| Hopi | 0.0 /100 | #317 | Tragic 10.9% |
| Immigrants | Cuba | 0.0 /100 | #318 | Tragic 10.9% |
| Kiowa | 0.0 /100 | #319 | Tragic 10.8% |
| Immigrants | Micronesia | 0.0 /100 | #320 | Tragic 10.8% |
| Pennsylvania Germans | 0.0 /100 | #321 | Tragic 10.7% |
| Sioux | 0.0 /100 | #322 | Tragic 10.7% |
Demographics Similar to French Canadians by Master's Degree
In terms of master's degree, the demographic groups most similar to French Canadians are Immigrants from Somalia (14.1%, a difference of 0.25%), Immigrants from Trinidad and Tobago (14.1%, a difference of 0.25%), Immigrants from Vietnam (14.1%, a difference of 0.32%), Norwegian (14.0%, a difference of 0.35%), and German (14.0%, a difference of 0.50%).
| Demographics | Rating | Rank | Master's Degree |
| Somalis | 18.0 /100 | #211 | Poor 14.2% |
| Spanish | 17.8 /100 | #212 | Poor 14.2% |
| Immigrants | Thailand | 17.0 /100 | #213 | Poor 14.2% |
| Finns | 16.9 /100 | #214 | Poor 14.2% |
| Immigrants | Vietnam | 16.1 /100 | #215 | Poor 14.1% |
| Immigrants | Somalia | 15.8 /100 | #216 | Poor 14.1% |
| Immigrants | Trinidad and Tobago | 15.8 /100 | #217 | Poor 14.1% |
| French Canadians | 14.9 /100 | #218 | Poor 14.1% |
| Norwegians | 13.6 /100 | #219 | Poor 14.0% |
| Germans | 13.1 /100 | #220 | Poor 14.0% |
| Koreans | 12.7 /100 | #221 | Poor 14.0% |
| Ecuadorians | 12.6 /100 | #222 | Poor 14.0% |
| Immigrants | South Eastern Asia | 11.9 /100 | #223 | Poor 14.0% |
| Immigrants | Grenada | 11.8 /100 | #224 | Poor 14.0% |
| Portuguese | 11.2 /100 | #225 | Poor 13.9% |