Lumbee vs Syrian Master's Degree
COMPARE
Lumbee
Syrian
Master's Degree
Master's Degree Comparison
Lumbee
Syrians
9.3%
MASTER'S DEGREE
0.0/ 100
METRIC RATING
343rd/ 347
METRIC RANK
16.8%
MASTER'S DEGREE
98.3/ 100
METRIC RATING
105th/ 347
METRIC RANK
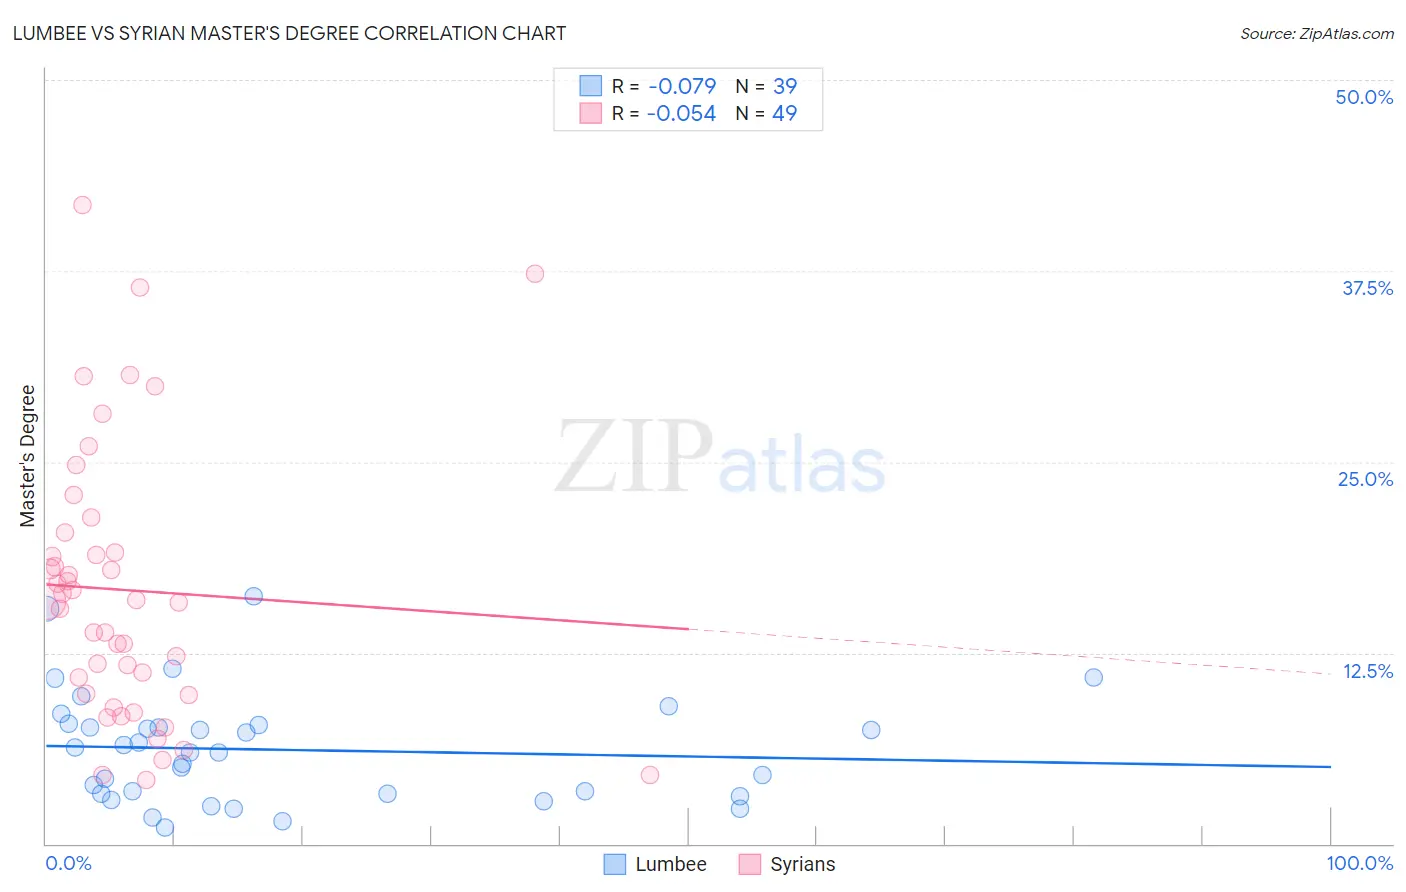
Lumbee vs Syrian Master's Degree Correlation Chart
The statistical analysis conducted on geographies consisting of 92,286,127 people shows a slight negative correlation between the proportion of Lumbee and percentage of population with at least master's degree education in the United States with a correlation coefficient (R) of -0.079 and weighted average of 9.3%. Similarly, the statistical analysis conducted on geographies consisting of 266,236,356 people shows a slight negative correlation between the proportion of Syrians and percentage of population with at least master's degree education in the United States with a correlation coefficient (R) of -0.054 and weighted average of 16.8%, a difference of 81.8%.
Master's Degree Correlation Summary
| Measurement | Lumbee | Syrian |
| Minimum | 1.0% | 4.2% |
| Maximum | 16.2% | 41.8% |
| Range | 15.2% | 37.6% |
| Mean | 6.2% | 16.6% |
| Median | 6.0% | 15.9% |
| Interquartile 25% (IQ1) | 3.3% | 9.8% |
| Interquartile 75% (IQ3) | 7.8% | 19.7% |
| Interquartile Range (IQR) | 4.5% | 9.9% |
| Standard Deviation (Sample) | 3.6% | 8.9% |
| Standard Deviation (Population) | 3.5% | 8.8% |
Similar Demographics by Master's Degree
Demographics Similar to Lumbee by Master's Degree
In terms of master's degree, the demographic groups most similar to Lumbee are Pima (9.2%, a difference of 0.17%), Yuman (9.2%, a difference of 0.32%), Immigrants from Mexico (9.3%, a difference of 0.48%), Navajo (9.4%, a difference of 1.8%), and Yakama (9.5%, a difference of 2.1%).
| Demographics | Rating | Rank | Master's Degree |
| Menominee | 0.0 /100 | #333 | Tragic 10.2% |
| Arapaho | 0.0 /100 | #334 | Tragic 10.0% |
| Immigrants | Central America | 0.0 /100 | #335 | Tragic 10.0% |
| Natives/Alaskans | 0.0 /100 | #336 | Tragic 9.9% |
| Mexicans | 0.0 /100 | #337 | Tragic 9.7% |
| Tohono O'odham | 0.0 /100 | #338 | Tragic 9.7% |
| Spanish American Indians | 0.0 /100 | #339 | Tragic 9.6% |
| Yakama | 0.0 /100 | #340 | Tragic 9.5% |
| Navajo | 0.0 /100 | #341 | Tragic 9.4% |
| Immigrants | Mexico | 0.0 /100 | #342 | Tragic 9.3% |
| Lumbee | 0.0 /100 | #343 | Tragic 9.3% |
| Pima | 0.0 /100 | #344 | Tragic 9.2% |
| Yuman | 0.0 /100 | #345 | Tragic 9.2% |
| Yup'ik | 0.0 /100 | #346 | Tragic 8.5% |
| Houma | 0.0 /100 | #347 | Tragic 7.9% |
Demographics Similar to Syrians by Master's Degree
In terms of master's degree, the demographic groups most similar to Syrians are Ukrainian (16.9%, a difference of 0.10%), Alsatian (16.9%, a difference of 0.22%), Immigrants from Albania (16.8%, a difference of 0.28%), Armenian (16.8%, a difference of 0.37%), and Sierra Leonean (16.8%, a difference of 0.40%).
| Demographics | Rating | Rank | Master's Degree |
| Immigrants | Ukraine | 98.8 /100 | #98 | Exceptional 17.0% |
| Laotians | 98.8 /100 | #99 | Exceptional 17.0% |
| Albanians | 98.7 /100 | #100 | Exceptional 17.0% |
| Immigrants | Nepal | 98.6 /100 | #101 | Exceptional 17.0% |
| Chileans | 98.6 /100 | #102 | Exceptional 16.9% |
| Alsatians | 98.4 /100 | #103 | Exceptional 16.9% |
| Ukrainians | 98.3 /100 | #104 | Exceptional 16.9% |
| Syrians | 98.3 /100 | #105 | Exceptional 16.8% |
| Immigrants | Albania | 98.1 /100 | #106 | Exceptional 16.8% |
| Armenians | 98.0 /100 | #107 | Exceptional 16.8% |
| Sierra Leoneans | 98.0 /100 | #108 | Exceptional 16.8% |
| Moroccans | 98.0 /100 | #109 | Exceptional 16.8% |
| Immigrants | Chile | 98.0 /100 | #110 | Exceptional 16.8% |
| Austrians | 97.8 /100 | #111 | Exceptional 16.7% |
| Macedonians | 97.7 /100 | #112 | Exceptional 16.7% |