Salvadoran vs Brazilian 9th Grade
COMPARE
Salvadoran
Brazilian
9th Grade
9th Grade Comparison
Salvadorans
Brazilians
89.6%
9TH GRADE
0.0/ 100
METRIC RATING
342nd/ 347
METRIC RANK
94.9%
9TH GRADE
49.8/ 100
METRIC RATING
175th/ 347
METRIC RANK
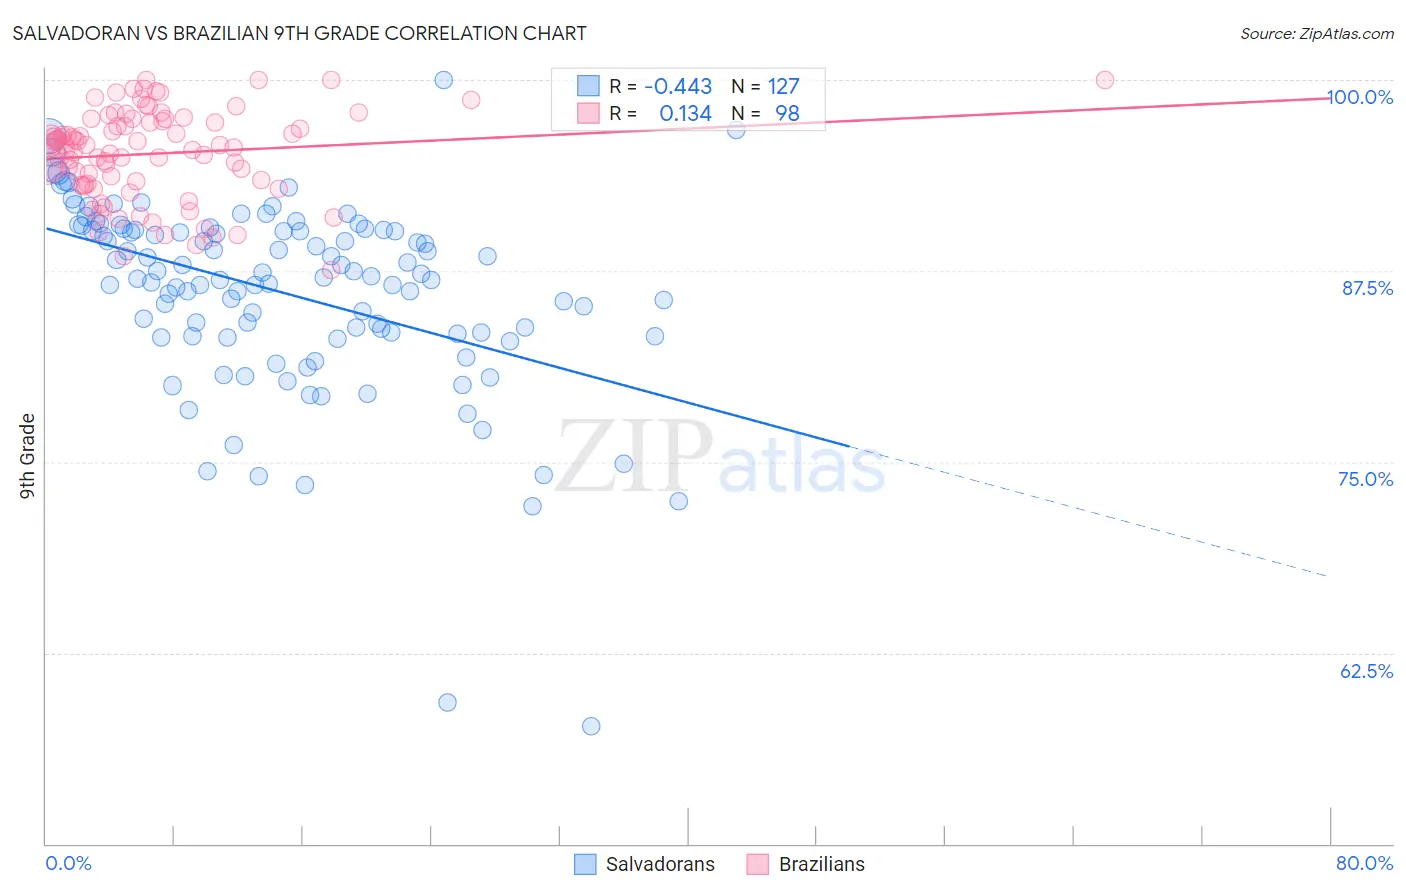
Salvadoran vs Brazilian 9th Grade Correlation Chart
The statistical analysis conducted on geographies consisting of 399,034,410 people shows a moderate negative correlation between the proportion of Salvadorans and percentage of population with at least 9th grade education in the United States with a correlation coefficient (R) of -0.443 and weighted average of 89.6%. Similarly, the statistical analysis conducted on geographies consisting of 323,900,771 people shows a poor positive correlation between the proportion of Brazilians and percentage of population with at least 9th grade education in the United States with a correlation coefficient (R) of 0.134 and weighted average of 94.9%, a difference of 5.9%.
9th Grade Correlation Summary
| Measurement | Salvadoran | Brazilian |
| Minimum | 57.7% | 87.6% |
| Maximum | 100.0% | 100.0% |
| Range | 42.3% | 12.4% |
| Mean | 86.0% | 95.2% |
| Median | 87.0% | 95.7% |
| Interquartile 25% (IQ1) | 83.2% | 93.2% |
| Interquartile 75% (IQ3) | 90.2% | 97.3% |
| Interquartile Range (IQR) | 7.0% | 4.1% |
| Standard Deviation (Sample) | 6.4% | 2.9% |
| Standard Deviation (Population) | 6.3% | 2.9% |
Similar Demographics by 9th Grade
Demographics Similar to Salvadorans by 9th Grade
In terms of 9th grade, the demographic groups most similar to Salvadorans are Immigrants from Guatemala (89.4%, a difference of 0.20%), Guatemalan (89.9%, a difference of 0.31%), Mexican (90.0%, a difference of 0.43%), Yakama (90.1%, a difference of 0.49%), and Immigrants from El Salvador (89.0%, a difference of 0.71%).
| Demographics | Rating | Rank | 9th Grade |
| Immigrants | Yemen | 0.0 /100 | #333 | Tragic 90.8% |
| Immigrants | Azores | 0.0 /100 | #334 | Tragic 90.8% |
| Immigrants | Honduras | 0.0 /100 | #335 | Tragic 90.6% |
| Immigrants | Dominican Republic | 0.0 /100 | #336 | Tragic 90.5% |
| Immigrants | Latin America | 0.0 /100 | #337 | Tragic 90.4% |
| Central Americans | 0.0 /100 | #338 | Tragic 90.4% |
| Yakama | 0.0 /100 | #339 | Tragic 90.1% |
| Mexicans | 0.0 /100 | #340 | Tragic 90.0% |
| Guatemalans | 0.0 /100 | #341 | Tragic 89.9% |
| Salvadorans | 0.0 /100 | #342 | Tragic 89.6% |
| Immigrants | Guatemala | 0.0 /100 | #343 | Tragic 89.4% |
| Immigrants | El Salvador | 0.0 /100 | #344 | Tragic 89.0% |
| Immigrants | Central America | 0.0 /100 | #345 | Tragic 89.0% |
| Immigrants | Mexico | 0.0 /100 | #346 | Tragic 88.7% |
| Spanish American Indians | 0.0 /100 | #347 | Tragic 88.3% |
Demographics Similar to Brazilians by 9th Grade
In terms of 9th grade, the demographic groups most similar to Brazilians are Immigrants from Egypt (94.9%, a difference of 0.0%), Cheyenne (94.9%, a difference of 0.010%), Immigrants from Spain (94.9%, a difference of 0.010%), Immigrants from Iraq (94.9%, a difference of 0.010%), and Immigrants from Poland (94.9%, a difference of 0.020%).
| Demographics | Rating | Rank | 9th Grade |
| Chileans | 60.7 /100 | #168 | Good 95.0% |
| Spaniards | 59.6 /100 | #169 | Average 94.9% |
| Alsatians | 58.6 /100 | #170 | Average 94.9% |
| Colville | 58.5 /100 | #171 | Average 94.9% |
| Iraqis | 54.0 /100 | #172 | Average 94.9% |
| Cheyenne | 51.5 /100 | #173 | Average 94.9% |
| Immigrants | Egypt | 50.0 /100 | #174 | Average 94.9% |
| Brazilians | 49.8 /100 | #175 | Average 94.9% |
| Immigrants | Spain | 49.1 /100 | #176 | Average 94.9% |
| Immigrants | Iraq | 47.8 /100 | #177 | Average 94.9% |
| Immigrants | Poland | 46.7 /100 | #178 | Average 94.9% |
| Immigrants | Venezuela | 46.5 /100 | #179 | Average 94.9% |
| Immigrants | Uganda | 43.1 /100 | #180 | Average 94.8% |
| Sierra Leoneans | 42.7 /100 | #181 | Average 94.8% |
| Seminole | 42.5 /100 | #182 | Average 94.8% |