Apache vs Slavic 9th Grade
COMPARE
Apache
Slavic
9th Grade
9th Grade Comparison
Apache
Slavs
94.3%
9TH GRADE
4.2/ 100
METRIC RATING
230th/ 347
METRIC RANK
96.1%
9TH GRADE
99.9/ 100
METRIC RATING
40th/ 347
METRIC RANK
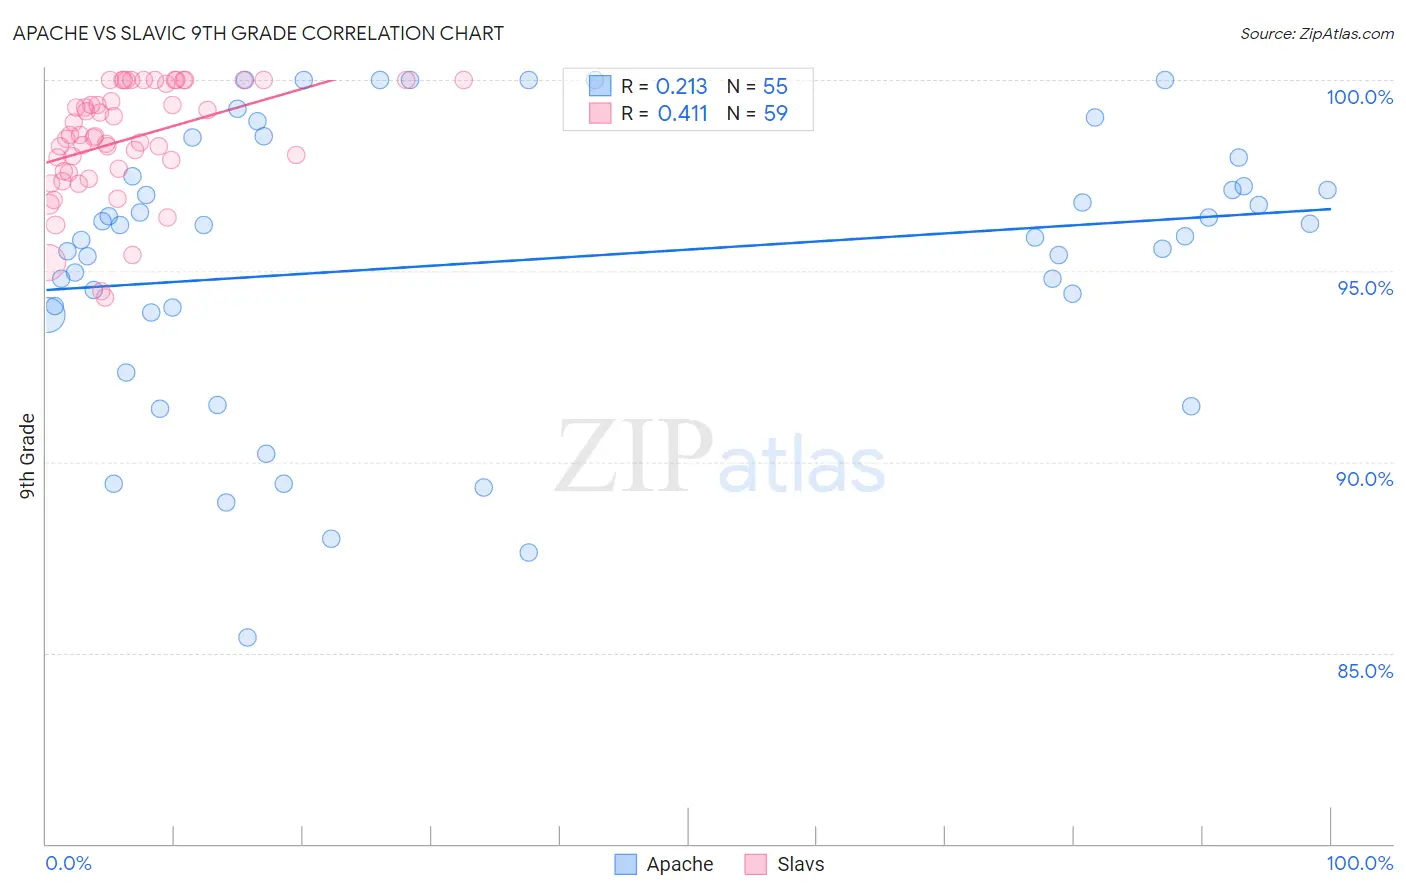
Apache vs Slavic 9th Grade Correlation Chart
The statistical analysis conducted on geographies consisting of 231,142,637 people shows a weak positive correlation between the proportion of Apache and percentage of population with at least 9th grade education in the United States with a correlation coefficient (R) of 0.213 and weighted average of 94.3%. Similarly, the statistical analysis conducted on geographies consisting of 270,868,354 people shows a moderate positive correlation between the proportion of Slavs and percentage of population with at least 9th grade education in the United States with a correlation coefficient (R) of 0.411 and weighted average of 96.1%, a difference of 1.9%.
9th Grade Correlation Summary
| Measurement | Apache | Slavic |
| Minimum | 85.4% | 94.3% |
| Maximum | 100.0% | 100.0% |
| Range | 14.6% | 5.7% |
| Mean | 95.3% | 98.5% |
| Median | 95.9% | 98.5% |
| Interquartile 25% (IQ1) | 93.9% | 97.6% |
| Interquartile 75% (IQ3) | 97.5% | 100.0% |
| Interquartile Range (IQR) | 3.6% | 2.4% |
| Standard Deviation (Sample) | 3.6% | 1.5% |
| Standard Deviation (Population) | 3.6% | 1.4% |
Similar Demographics by 9th Grade
Demographics Similar to Apache by 9th Grade
In terms of 9th grade, the demographic groups most similar to Apache are Immigrants from Panama (94.3%, a difference of 0.010%), Immigrants from Africa (94.3%, a difference of 0.010%), Lumbee (94.4%, a difference of 0.020%), Immigrants from Southern Europe (94.3%, a difference of 0.020%), and Nigerian (94.3%, a difference of 0.020%).
| Demographics | Rating | Rank | 9th Grade |
| Bahamians | 7.0 /100 | #223 | Tragic 94.4% |
| Tongans | 6.0 /100 | #224 | Tragic 94.4% |
| Ethiopians | 5.4 /100 | #225 | Tragic 94.4% |
| Sub-Saharan Africans | 5.4 /100 | #226 | Tragic 94.4% |
| Immigrants | Sierra Leone | 4.8 /100 | #227 | Tragic 94.4% |
| Lumbee | 4.7 /100 | #228 | Tragic 94.4% |
| Immigrants | Southern Europe | 4.5 /100 | #229 | Tragic 94.3% |
| Apache | 4.2 /100 | #230 | Tragic 94.3% |
| Immigrants | Panama | 4.0 /100 | #231 | Tragic 94.3% |
| Immigrants | Africa | 3.9 /100 | #232 | Tragic 94.3% |
| Nigerians | 3.7 /100 | #233 | Tragic 94.3% |
| Costa Ricans | 3.5 /100 | #234 | Tragic 94.3% |
| Bolivians | 3.3 /100 | #235 | Tragic 94.3% |
| Somalis | 2.9 /100 | #236 | Tragic 94.3% |
| Koreans | 2.9 /100 | #237 | Tragic 94.3% |
Demographics Similar to Slavs by 9th Grade
In terms of 9th grade, the demographic groups most similar to Slavs are Czechoslovakian (96.1%, a difference of 0.010%), Chippewa (96.1%, a difference of 0.010%), Ottawa (96.1%, a difference of 0.020%), Iranian (96.1%, a difference of 0.020%), and Estonian (96.1%, a difference of 0.040%).
| Demographics | Rating | Rank | 9th Grade |
| Luxembourgers | 100.0 /100 | #33 | Exceptional 96.3% |
| Hungarians | 100.0 /100 | #34 | Exceptional 96.2% |
| Bulgarians | 99.9 /100 | #35 | Exceptional 96.2% |
| Northern Europeans | 99.9 /100 | #36 | Exceptional 96.2% |
| Estonians | 99.9 /100 | #37 | Exceptional 96.1% |
| Immigrants | Scotland | 99.9 /100 | #38 | Exceptional 96.1% |
| Ottawa | 99.9 /100 | #39 | Exceptional 96.1% |
| Slavs | 99.9 /100 | #40 | Exceptional 96.1% |
| Czechoslovakians | 99.9 /100 | #41 | Exceptional 96.1% |
| Chippewa | 99.9 /100 | #42 | Exceptional 96.1% |
| Iranians | 99.9 /100 | #43 | Exceptional 96.1% |
| Alaska Natives | 99.9 /100 | #44 | Exceptional 96.1% |
| Crow | 99.9 /100 | #45 | Exceptional 96.1% |
| Immigrants | India | 99.9 /100 | #46 | Exceptional 96.1% |
| Russians | 99.9 /100 | #47 | Exceptional 96.0% |