Immigrants from Switzerland vs Brazilian 9th Grade
COMPARE
Immigrants from Switzerland
Brazilian
9th Grade
9th Grade Comparison
Immigrants from Switzerland
Brazilians
95.5%
9TH GRADE
97.7/ 100
METRIC RATING
102nd/ 347
METRIC RANK
94.9%
9TH GRADE
49.8/ 100
METRIC RATING
175th/ 347
METRIC RANK
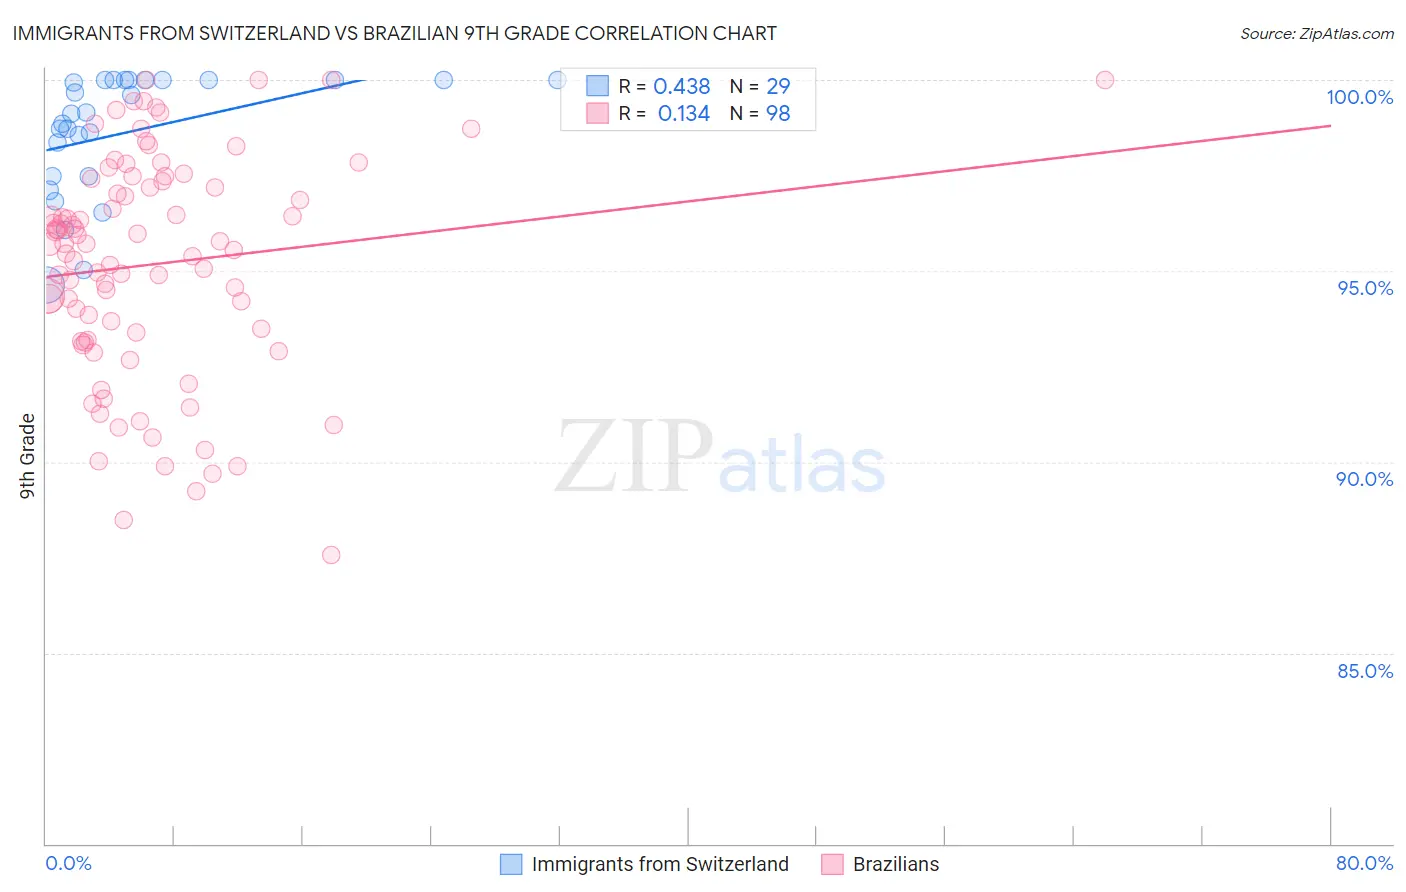
Immigrants from Switzerland vs Brazilian 9th Grade Correlation Chart
The statistical analysis conducted on geographies consisting of 148,082,451 people shows a moderate positive correlation between the proportion of Immigrants from Switzerland and percentage of population with at least 9th grade education in the United States with a correlation coefficient (R) of 0.438 and weighted average of 95.5%. Similarly, the statistical analysis conducted on geographies consisting of 323,900,771 people shows a poor positive correlation between the proportion of Brazilians and percentage of population with at least 9th grade education in the United States with a correlation coefficient (R) of 0.134 and weighted average of 94.9%, a difference of 0.69%.
9th Grade Correlation Summary
| Measurement | Immigrants from Switzerland | Brazilian |
| Minimum | 94.6% | 87.6% |
| Maximum | 100.0% | 100.0% |
| Range | 5.4% | 12.4% |
| Mean | 98.6% | 95.2% |
| Median | 99.1% | 95.7% |
| Interquartile 25% (IQ1) | 97.5% | 93.2% |
| Interquartile 75% (IQ3) | 100.0% | 97.3% |
| Interquartile Range (IQR) | 2.5% | 4.1% |
| Standard Deviation (Sample) | 1.6% | 2.9% |
| Standard Deviation (Population) | 1.6% | 2.9% |
Similar Demographics by 9th Grade
Demographics Similar to Immigrants from Switzerland by 9th Grade
In terms of 9th grade, the demographic groups most similar to Immigrants from Switzerland are Potawatomi (95.5%, a difference of 0.0%), Immigrants from Moldova (95.5%, a difference of 0.010%), Syrian (95.5%, a difference of 0.030%), Immigrants from France (95.5%, a difference of 0.030%), and Lebanese (95.6%, a difference of 0.040%).
| Demographics | Rating | Rank | 9th Grade |
| Americans | 98.5 /100 | #95 | Exceptional 95.6% |
| Filipinos | 98.5 /100 | #96 | Exceptional 95.6% |
| Delaware | 98.4 /100 | #97 | Exceptional 95.6% |
| Immigrants | Japan | 98.4 /100 | #98 | Exceptional 95.6% |
| Menominee | 98.3 /100 | #99 | Exceptional 95.6% |
| Lebanese | 98.1 /100 | #100 | Exceptional 95.6% |
| Immigrants | Moldova | 97.9 /100 | #101 | Exceptional 95.5% |
| Immigrants | Switzerland | 97.7 /100 | #102 | Exceptional 95.5% |
| Potawatomi | 97.7 /100 | #103 | Exceptional 95.5% |
| Syrians | 97.4 /100 | #104 | Exceptional 95.5% |
| Immigrants | France | 97.4 /100 | #105 | Exceptional 95.5% |
| Immigrants | Norway | 97.1 /100 | #106 | Exceptional 95.5% |
| Immigrants | Zimbabwe | 96.9 /100 | #107 | Exceptional 95.5% |
| Chickasaw | 96.8 /100 | #108 | Exceptional 95.5% |
| Osage | 96.8 /100 | #109 | Exceptional 95.5% |
Demographics Similar to Brazilians by 9th Grade
In terms of 9th grade, the demographic groups most similar to Brazilians are Immigrants from Egypt (94.9%, a difference of 0.0%), Cheyenne (94.9%, a difference of 0.010%), Immigrants from Spain (94.9%, a difference of 0.010%), Immigrants from Iraq (94.9%, a difference of 0.010%), and Immigrants from Poland (94.9%, a difference of 0.020%).
| Demographics | Rating | Rank | 9th Grade |
| Chileans | 60.7 /100 | #168 | Good 95.0% |
| Spaniards | 59.6 /100 | #169 | Average 94.9% |
| Alsatians | 58.6 /100 | #170 | Average 94.9% |
| Colville | 58.5 /100 | #171 | Average 94.9% |
| Iraqis | 54.0 /100 | #172 | Average 94.9% |
| Cheyenne | 51.5 /100 | #173 | Average 94.9% |
| Immigrants | Egypt | 50.0 /100 | #174 | Average 94.9% |
| Brazilians | 49.8 /100 | #175 | Average 94.9% |
| Immigrants | Spain | 49.1 /100 | #176 | Average 94.9% |
| Immigrants | Iraq | 47.8 /100 | #177 | Average 94.9% |
| Immigrants | Poland | 46.7 /100 | #178 | Average 94.9% |
| Immigrants | Venezuela | 46.5 /100 | #179 | Average 94.9% |
| Immigrants | Uganda | 43.1 /100 | #180 | Average 94.8% |
| Sierra Leoneans | 42.7 /100 | #181 | Average 94.8% |
| Seminole | 42.5 /100 | #182 | Average 94.8% |