Immigrants from Haiti vs Bhutanese GED/Equivalency
COMPARE
Immigrants from Haiti
Bhutanese
GED/Equivalency
GED/Equivalency Comparison
Immigrants from Haiti
Bhutanese
81.6%
GED/EQUIVALENCY
0.0/ 100
METRIC RATING
302nd/ 347
METRIC RANK
88.4%
GED/EQUIVALENCY
99.8/ 100
METRIC RATING
31st/ 347
METRIC RANK
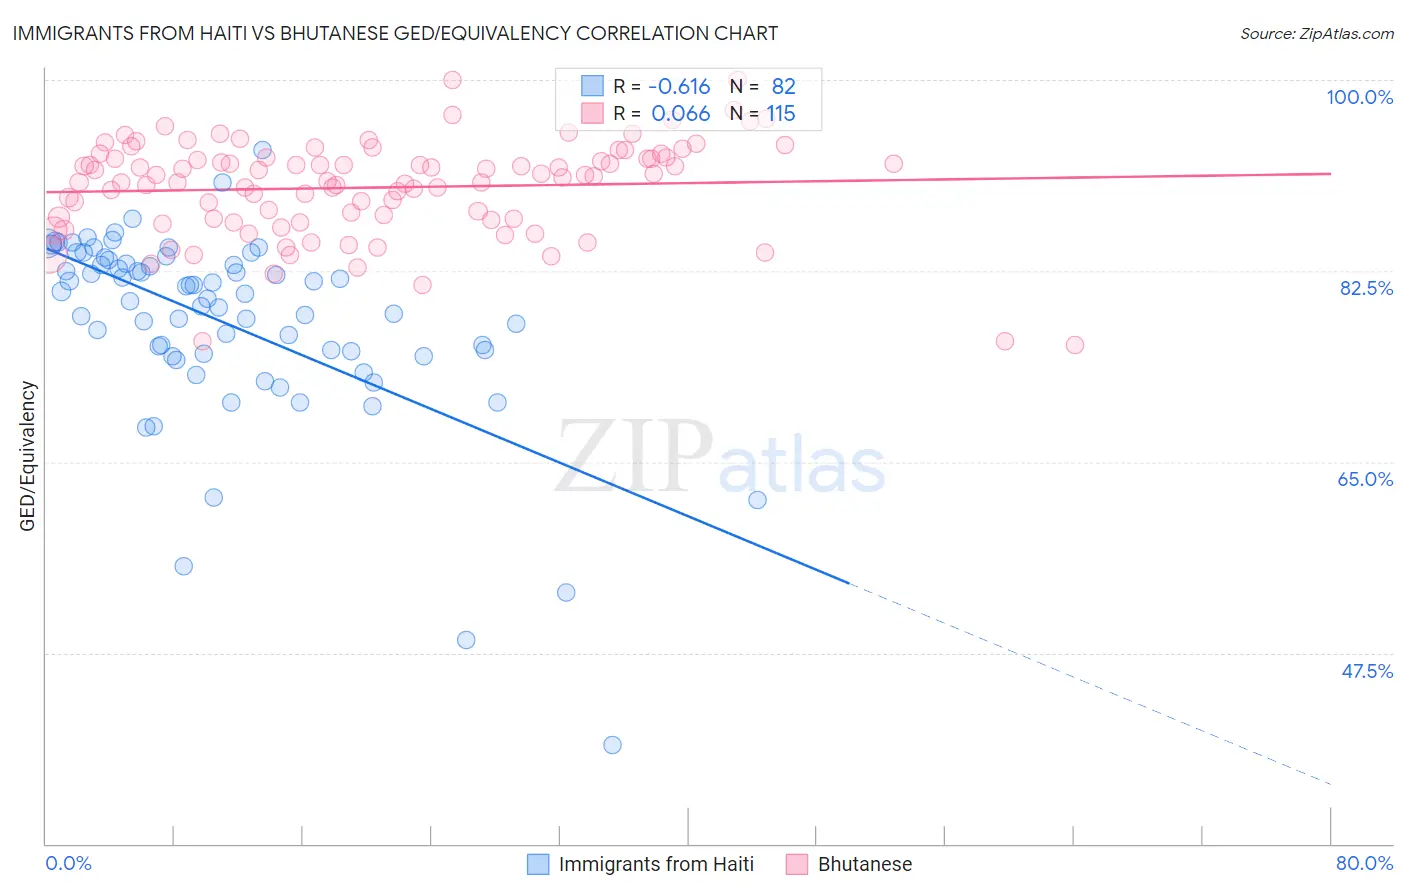
Immigrants from Haiti vs Bhutanese GED/Equivalency Correlation Chart
The statistical analysis conducted on geographies consisting of 225,286,636 people shows a significant negative correlation between the proportion of Immigrants from Haiti and percentage of population with at least ged/equivalency education in the United States with a correlation coefficient (R) of -0.616 and weighted average of 81.6%. Similarly, the statistical analysis conducted on geographies consisting of 455,590,907 people shows a slight positive correlation between the proportion of Bhutanese and percentage of population with at least ged/equivalency education in the United States with a correlation coefficient (R) of 0.066 and weighted average of 88.4%, a difference of 8.5%.
GED/Equivalency Correlation Summary
| Measurement | Immigrants from Haiti | Bhutanese |
| Minimum | 39.0% | 75.7% |
| Maximum | 93.6% | 100.0% |
| Range | 54.6% | 24.3% |
| Mean | 77.8% | 90.2% |
| Median | 80.2% | 91.1% |
| Interquartile 25% (IQ1) | 74.9% | 87.3% |
| Interquartile 75% (IQ3) | 83.1% | 92.9% |
| Interquartile Range (IQR) | 8.2% | 5.6% |
| Standard Deviation (Sample) | 8.8% | 4.5% |
| Standard Deviation (Population) | 8.8% | 4.5% |
Similar Demographics by GED/Equivalency
Demographics Similar to Immigrants from Haiti by GED/Equivalency
In terms of ged/equivalency, the demographic groups most similar to Immigrants from Haiti are Immigrants from Portugal (81.6%, a difference of 0.0%), Dutch West Indian (81.6%, a difference of 0.040%), Fijian (81.6%, a difference of 0.10%), Navajo (81.5%, a difference of 0.10%), and Ecuadorian (81.7%, a difference of 0.16%).
| Demographics | Rating | Rank | GED/Equivalency |
| Nepalese | 0.0 /100 | #295 | Tragic 81.9% |
| Vietnamese | 0.0 /100 | #296 | Tragic 81.9% |
| Immigrants | Bangladesh | 0.0 /100 | #297 | Tragic 81.9% |
| Ute | 0.0 /100 | #298 | Tragic 81.8% |
| Ecuadorians | 0.0 /100 | #299 | Tragic 81.7% |
| Fijians | 0.0 /100 | #300 | Tragic 81.6% |
| Dutch West Indians | 0.0 /100 | #301 | Tragic 81.6% |
| Immigrants | Haiti | 0.0 /100 | #302 | Tragic 81.6% |
| Immigrants | Portugal | 0.0 /100 | #303 | Tragic 81.6% |
| Navajo | 0.0 /100 | #304 | Tragic 81.5% |
| Immigrants | Grenada | 0.0 /100 | #305 | Tragic 81.3% |
| Guyanese | 0.0 /100 | #306 | Tragic 81.3% |
| Immigrants | Dominica | 0.0 /100 | #307 | Tragic 81.1% |
| Puerto Ricans | 0.0 /100 | #308 | Tragic 81.1% |
| Immigrants | Ecuador | 0.0 /100 | #309 | Tragic 81.0% |
Demographics Similar to Bhutanese by GED/Equivalency
In terms of ged/equivalency, the demographic groups most similar to Bhutanese are Danish (88.4%, a difference of 0.020%), Turkish (88.5%, a difference of 0.030%), Polish (88.5%, a difference of 0.050%), Immigrants from Sweden (88.4%, a difference of 0.060%), and Immigrants from Japan (88.4%, a difference of 0.070%).
| Demographics | Rating | Rank | GED/Equivalency |
| Slovaks | 99.8 /100 | #24 | Exceptional 88.6% |
| Estonians | 99.8 /100 | #25 | Exceptional 88.6% |
| Immigrants | Australia | 99.8 /100 | #26 | Exceptional 88.6% |
| Immigrants | Lithuania | 99.8 /100 | #27 | Exceptional 88.6% |
| Immigrants | Northern Europe | 99.8 /100 | #28 | Exceptional 88.5% |
| Poles | 99.8 /100 | #29 | Exceptional 88.5% |
| Turks | 99.8 /100 | #30 | Exceptional 88.5% |
| Bhutanese | 99.8 /100 | #31 | Exceptional 88.4% |
| Danes | 99.8 /100 | #32 | Exceptional 88.4% |
| Immigrants | Sweden | 99.7 /100 | #33 | Exceptional 88.4% |
| Immigrants | Japan | 99.7 /100 | #34 | Exceptional 88.4% |
| Immigrants | South Central Asia | 99.7 /100 | #35 | Exceptional 88.4% |
| Immigrants | Belgium | 99.7 /100 | #36 | Exceptional 88.3% |
| Immigrants | Austria | 99.7 /100 | #37 | Exceptional 88.3% |
| Burmese | 99.7 /100 | #38 | Exceptional 88.3% |