American vs Asian Master's Degree
COMPARE
American
Asian
Master's Degree
Master's Degree Comparison
Americans
Asians
12.3%
MASTER'S DEGREE
0.4/ 100
METRIC RATING
267th/ 347
METRIC RANK
18.4%
MASTER'S DEGREE
99.9/ 100
METRIC RATING
56th/ 347
METRIC RANK
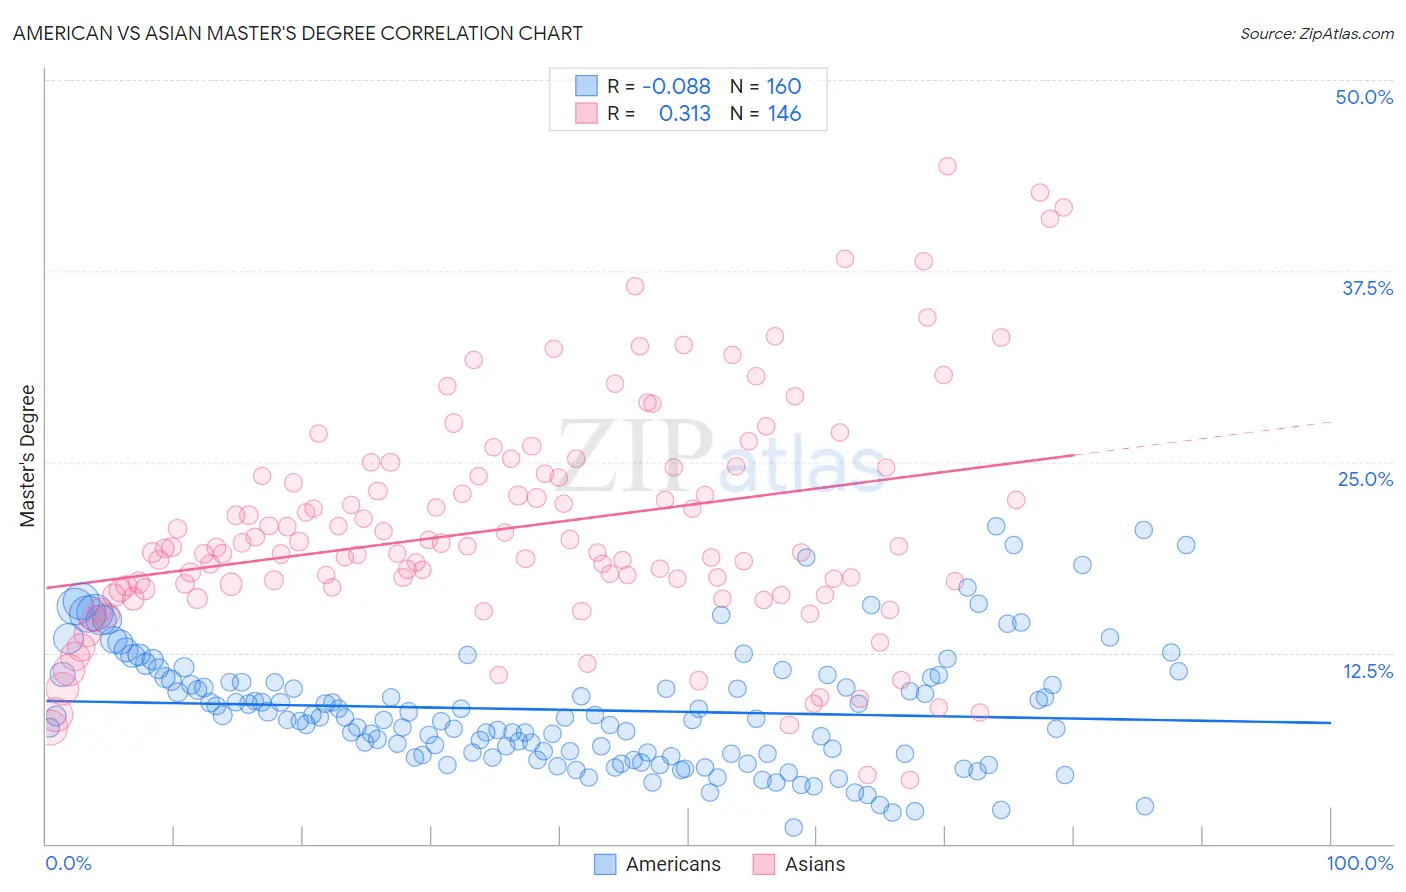
American vs Asian Master's Degree Correlation Chart
The statistical analysis conducted on geographies consisting of 580,510,045 people shows a slight negative correlation between the proportion of Americans and percentage of population with at least master's degree education in the United States with a correlation coefficient (R) of -0.088 and weighted average of 12.3%. Similarly, the statistical analysis conducted on geographies consisting of 550,412,618 people shows a mild positive correlation between the proportion of Asians and percentage of population with at least master's degree education in the United States with a correlation coefficient (R) of 0.313 and weighted average of 18.4%, a difference of 49.9%.
Master's Degree Correlation Summary
| Measurement | American | Asian |
| Minimum | 1.1% | 4.2% |
| Maximum | 20.8% | 44.3% |
| Range | 19.8% | 40.2% |
| Mean | 8.8% | 20.7% |
| Median | 8.3% | 19.3% |
| Interquartile 25% (IQ1) | 5.9% | 16.8% |
| Interquartile 75% (IQ3) | 10.8% | 24.2% |
| Interquartile Range (IQR) | 4.9% | 7.4% |
| Standard Deviation (Sample) | 3.9% | 7.5% |
| Standard Deviation (Population) | 3.9% | 7.5% |
Similar Demographics by Master's Degree
Demographics Similar to Americans by Master's Degree
In terms of master's degree, the demographic groups most similar to Americans are Native Hawaiian (12.3%, a difference of 0.25%), Bahamian (12.4%, a difference of 0.76%), Central American (12.2%, a difference of 0.90%), Immigrants from Fiji (12.4%, a difference of 0.91%), and Belizean (12.4%, a difference of 0.93%).
| Demographics | Rating | Rank | Master's Degree |
| Dominicans | 0.6 /100 | #260 | Tragic 12.5% |
| Tongans | 0.6 /100 | #261 | Tragic 12.5% |
| Nicaraguans | 0.6 /100 | #262 | Tragic 12.5% |
| Central American Indians | 0.5 /100 | #263 | Tragic 12.4% |
| Belizeans | 0.5 /100 | #264 | Tragic 12.4% |
| Immigrants | Fiji | 0.5 /100 | #265 | Tragic 12.4% |
| Bahamians | 0.5 /100 | #266 | Tragic 12.4% |
| Americans | 0.4 /100 | #267 | Tragic 12.3% |
| Native Hawaiians | 0.4 /100 | #268 | Tragic 12.3% |
| Central Americans | 0.3 /100 | #269 | Tragic 12.2% |
| Salvadorans | 0.3 /100 | #270 | Tragic 12.2% |
| Haitians | 0.3 /100 | #271 | Tragic 12.1% |
| Comanche | 0.3 /100 | #272 | Tragic 12.1% |
| Blackfeet | 0.3 /100 | #273 | Tragic 12.1% |
| Cape Verdeans | 0.3 /100 | #274 | Tragic 12.1% |
Demographics Similar to Asians by Master's Degree
In terms of master's degree, the demographic groups most similar to Asians are Immigrants from Asia (18.4%, a difference of 0.14%), Immigrants from Serbia (18.5%, a difference of 0.22%), Immigrants from Lithuania (18.5%, a difference of 0.26%), Australian (18.4%, a difference of 0.27%), and Immigrants from Czechoslovakia (18.5%, a difference of 0.57%).
| Demographics | Rating | Rank | Master's Degree |
| Estonians | 100.0 /100 | #49 | Exceptional 18.8% |
| Bulgarians | 100.0 /100 | #50 | Exceptional 18.8% |
| Immigrants | South Africa | 100.0 /100 | #51 | Exceptional 18.8% |
| Immigrants | Kuwait | 100.0 /100 | #52 | Exceptional 18.6% |
| Immigrants | Czechoslovakia | 99.9 /100 | #53 | Exceptional 18.5% |
| Immigrants | Lithuania | 99.9 /100 | #54 | Exceptional 18.5% |
| Immigrants | Serbia | 99.9 /100 | #55 | Exceptional 18.5% |
| Asians | 99.9 /100 | #56 | Exceptional 18.4% |
| Immigrants | Asia | 99.9 /100 | #57 | Exceptional 18.4% |
| Australians | 99.9 /100 | #58 | Exceptional 18.4% |
| Immigrants | Bulgaria | 99.9 /100 | #59 | Exceptional 18.3% |
| New Zealanders | 99.9 /100 | #60 | Exceptional 18.3% |
| Immigrants | Europe | 99.9 /100 | #61 | Exceptional 18.2% |
| Argentineans | 99.9 /100 | #62 | Exceptional 18.2% |
| Immigrants | Netherlands | 99.9 /100 | #63 | Exceptional 18.1% |