Alsatian vs U.S. Virgin Islander No Schooling Completed
COMPARE
Alsatian
U.S. Virgin Islander
No Schooling Completed
No Schooling Completed Comparison
Alsatians
U.S. Virgin Islanders
2.0%
NO SCHOOLING COMPLETED
79.1/ 100
METRIC RATING
144th/ 347
METRIC RANK
2.3%
NO SCHOOLING COMPLETED
3.7/ 100
METRIC RATING
228th/ 347
METRIC RANK
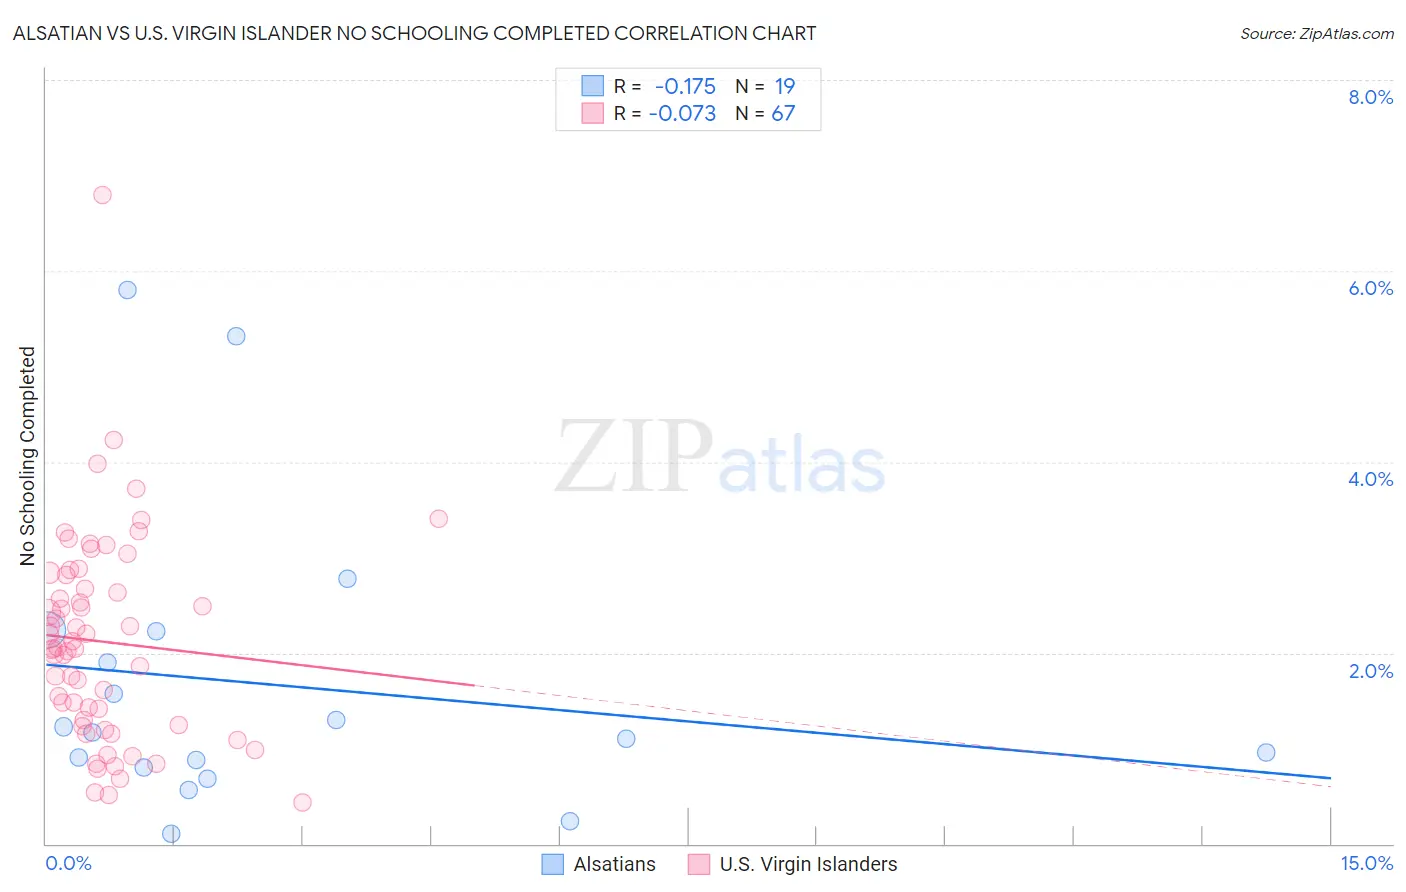
Alsatian vs U.S. Virgin Islander No Schooling Completed Correlation Chart
The statistical analysis conducted on geographies consisting of 82,371,288 people shows a poor negative correlation between the proportion of Alsatians and percentage of population with no schooling in the United States with a correlation coefficient (R) of -0.175 and weighted average of 2.0%. Similarly, the statistical analysis conducted on geographies consisting of 87,394,001 people shows a slight negative correlation between the proportion of U.S. Virgin Islanders and percentage of population with no schooling in the United States with a correlation coefficient (R) of -0.073 and weighted average of 2.3%, a difference of 16.1%.
No Schooling Completed Correlation Summary
| Measurement | Alsatian | U.S. Virgin Islander |
| Minimum | 0.10% | 0.43% |
| Maximum | 5.8% | 6.8% |
| Range | 5.7% | 6.4% |
| Mean | 1.7% | 2.1% |
| Median | 1.2% | 2.0% |
| Interquartile 25% (IQ1) | 0.80% | 1.2% |
| Interquartile 75% (IQ3) | 2.2% | 2.8% |
| Interquartile Range (IQR) | 1.4% | 1.6% |
| Standard Deviation (Sample) | 1.5% | 1.1% |
| Standard Deviation (Population) | 1.5% | 1.1% |
Similar Demographics by No Schooling Completed
Demographics Similar to Alsatians by No Schooling Completed
In terms of no schooling completed, the demographic groups most similar to Alsatians are Immigrants from Iran (2.0%, a difference of 0.010%), Immigrants from South Central Asia (2.0%, a difference of 0.20%), Immigrants from Moldova (2.0%, a difference of 0.22%), Soviet Union (2.0%, a difference of 0.40%), and Shoshone (2.0%, a difference of 0.48%).
| Demographics | Rating | Rank | No Schooling Completed |
| Filipinos | 85.5 /100 | #137 | Excellent 2.0% |
| Immigrants | Israel | 85.4 /100 | #138 | Excellent 2.0% |
| Jordanians | 84.5 /100 | #139 | Excellent 2.0% |
| Marshallese | 83.5 /100 | #140 | Excellent 2.0% |
| Immigrants | Greece | 83.5 /100 | #141 | Excellent 2.0% |
| Venezuelans | 81.5 /100 | #142 | Excellent 2.0% |
| Immigrants | South Central Asia | 80.0 /100 | #143 | Good 2.0% |
| Alsatians | 79.1 /100 | #144 | Good 2.0% |
| Immigrants | Iran | 79.0 /100 | #145 | Good 2.0% |
| Immigrants | Moldova | 78.0 /100 | #146 | Good 2.0% |
| Soviet Union | 77.1 /100 | #147 | Good 2.0% |
| Shoshone | 76.7 /100 | #148 | Good 2.0% |
| Immigrants | North Macedonia | 75.9 /100 | #149 | Good 2.0% |
| Blackfeet | 72.9 /100 | #150 | Good 2.0% |
| Immigrants | Jordan | 70.9 /100 | #151 | Good 2.0% |
Demographics Similar to U.S. Virgin Islanders by No Schooling Completed
In terms of no schooling completed, the demographic groups most similar to U.S. Virgin Islanders are Immigrants from Pakistan (2.3%, a difference of 0.080%), Puerto Rican (2.3%, a difference of 0.22%), Immigrants from Uruguay (2.3%, a difference of 0.24%), Immigrants from Uganda (2.3%, a difference of 0.29%), and Sierra Leonean (2.3%, a difference of 0.34%).
| Demographics | Rating | Rank | No Schooling Completed |
| Immigrants | Sudan | 5.0 /100 | #221 | Tragic 2.3% |
| Sub-Saharan Africans | 4.7 /100 | #222 | Tragic 2.3% |
| Immigrants | Lebanon | 4.5 /100 | #223 | Tragic 2.3% |
| Tohono O'odham | 4.1 /100 | #224 | Tragic 2.3% |
| Sudanese | 4.1 /100 | #225 | Tragic 2.3% |
| Sierra Leoneans | 4.1 /100 | #226 | Tragic 2.3% |
| Immigrants | Uganda | 4.0 /100 | #227 | Tragic 2.3% |
| U.S. Virgin Islanders | 3.7 /100 | #228 | Tragic 2.3% |
| Immigrants | Pakistan | 3.6 /100 | #229 | Tragic 2.3% |
| Puerto Ricans | 3.4 /100 | #230 | Tragic 2.3% |
| Immigrants | Uruguay | 3.4 /100 | #231 | Tragic 2.3% |
| Colombians | 3.2 /100 | #232 | Tragic 2.3% |
| Immigrants | Malaysia | 2.8 /100 | #233 | Tragic 2.3% |
| Nigerians | 2.6 /100 | #234 | Tragic 2.3% |
| Immigrants | Western Asia | 2.6 /100 | #235 | Tragic 2.3% |