Alsatian vs Immigrants from Bolivia Doctorate Degree
COMPARE
Alsatian
Immigrants from Bolivia
Doctorate Degree
Doctorate Degree Comparison
Alsatians
Immigrants from Bolivia
2.1%
DOCTORATE DEGREE
99.0/ 100
METRIC RATING
93rd/ 347
METRIC RANK
2.3%
DOCTORATE DEGREE
99.8/ 100
METRIC RATING
71st/ 347
METRIC RANK
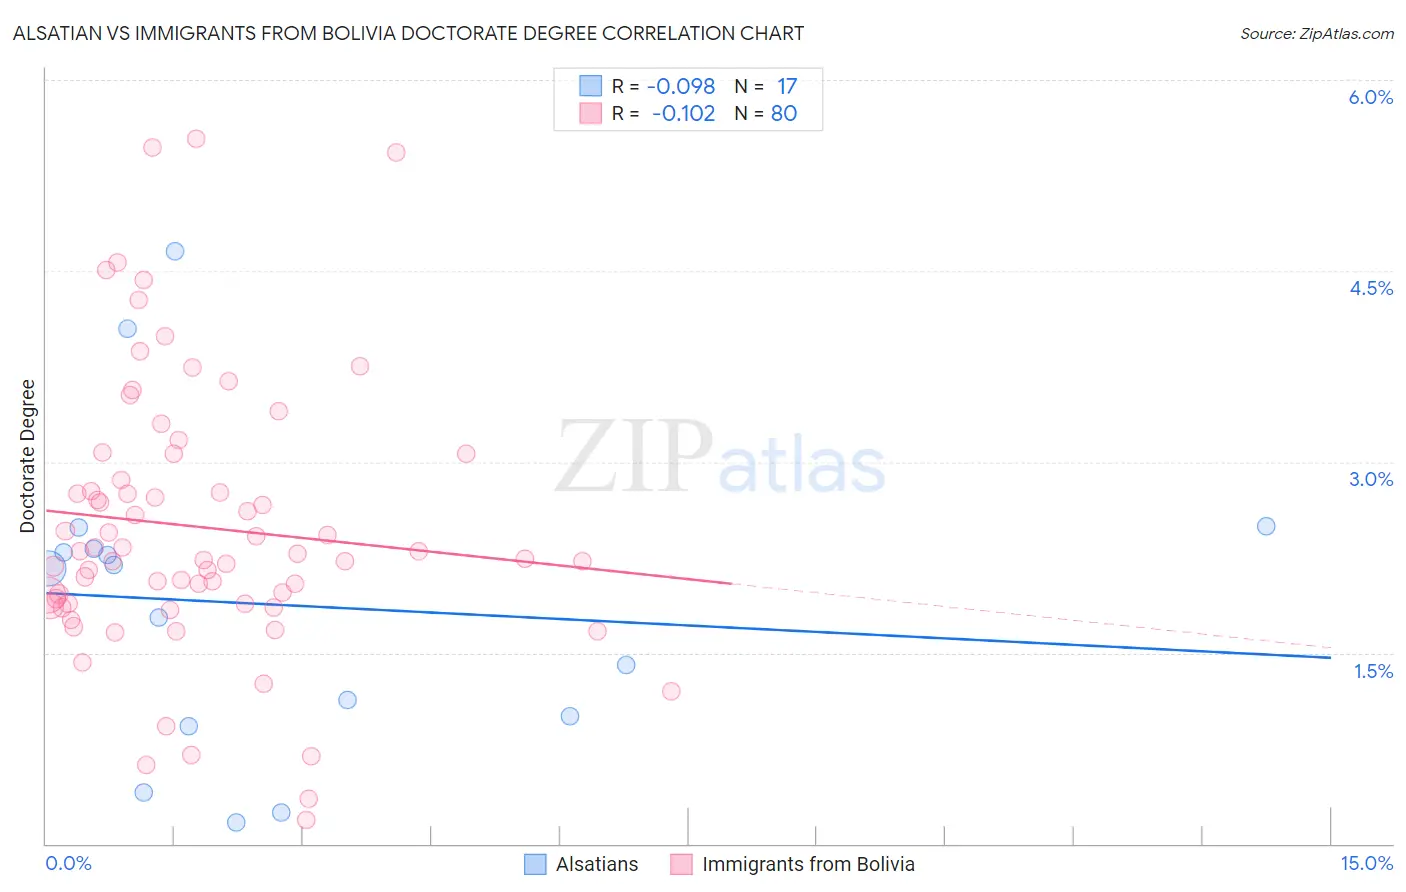
Alsatian vs Immigrants from Bolivia Doctorate Degree Correlation Chart
The statistical analysis conducted on geographies consisting of 82,508,744 people shows a slight negative correlation between the proportion of Alsatians and percentage of population with at least doctorate degree education in the United States with a correlation coefficient (R) of -0.098 and weighted average of 2.1%. Similarly, the statistical analysis conducted on geographies consisting of 158,321,845 people shows a poor negative correlation between the proportion of Immigrants from Bolivia and percentage of population with at least doctorate degree education in the United States with a correlation coefficient (R) of -0.102 and weighted average of 2.3%, a difference of 5.2%.
Doctorate Degree Correlation Summary
| Measurement | Alsatian | Immigrants from Bolivia |
| Minimum | 0.17% | 0.19% |
| Maximum | 4.7% | 5.5% |
| Range | 4.5% | 5.3% |
| Mean | 1.9% | 2.5% |
| Median | 2.2% | 2.3% |
| Interquartile 25% (IQ1) | 0.96% | 1.9% |
| Interquartile 75% (IQ3) | 2.4% | 3.0% |
| Interquartile Range (IQR) | 1.4% | 1.1% |
| Standard Deviation (Sample) | 1.2% | 1.1% |
| Standard Deviation (Population) | 1.2% | 1.1% |
Similar Demographics by Doctorate Degree
Demographics Similar to Alsatians by Doctorate Degree
In terms of doctorate degree, the demographic groups most similar to Alsatians are Chilean (2.2%, a difference of 0.22%), Immigrants from Sudan (2.2%, a difference of 0.48%), Greek (2.1%, a difference of 0.64%), Immigrants from Romania (2.1%, a difference of 0.78%), and Immigrants from Scotland (2.2%, a difference of 0.95%).
| Demographics | Rating | Rank | Doctorate Degree |
| Egyptians | 99.4 /100 | #86 | Exceptional 2.2% |
| Immigrants | Zimbabwe | 99.4 /100 | #87 | Exceptional 2.2% |
| Immigrants | Nepal | 99.3 /100 | #88 | Exceptional 2.2% |
| British | 99.3 /100 | #89 | Exceptional 2.2% |
| Immigrants | Scotland | 99.2 /100 | #90 | Exceptional 2.2% |
| Immigrants | Sudan | 99.1 /100 | #91 | Exceptional 2.2% |
| Chileans | 99.1 /100 | #92 | Exceptional 2.2% |
| Alsatians | 99.0 /100 | #93 | Exceptional 2.1% |
| Greeks | 98.8 /100 | #94 | Exceptional 2.1% |
| Immigrants | Romania | 98.7 /100 | #95 | Exceptional 2.1% |
| Immigrants | Northern Africa | 98.4 /100 | #96 | Exceptional 2.1% |
| Immigrants | Eritrea | 98.4 /100 | #97 | Exceptional 2.1% |
| Armenians | 98.3 /100 | #98 | Exceptional 2.1% |
| Immigrants | Egypt | 98.2 /100 | #99 | Exceptional 2.1% |
| Immigrants | Eastern Europe | 98.2 /100 | #100 | Exceptional 2.1% |
Demographics Similar to Immigrants from Bolivia by Doctorate Degree
In terms of doctorate degree, the demographic groups most similar to Immigrants from Bolivia are Lithuanian (2.3%, a difference of 0.0%), Carpatho Rusyn (2.3%, a difference of 0.14%), Immigrants from Canada (2.3%, a difference of 0.16%), Immigrants from Bulgaria (2.3%, a difference of 0.24%), and Immigrants from North America (2.2%, a difference of 0.38%).
| Demographics | Rating | Rank | Doctorate Degree |
| Immigrants | Greece | 99.9 /100 | #64 | Exceptional 2.3% |
| Paraguayans | 99.9 /100 | #65 | Exceptional 2.3% |
| Argentineans | 99.9 /100 | #66 | Exceptional 2.3% |
| Zimbabweans | 99.8 /100 | #67 | Exceptional 2.3% |
| Immigrants | Kazakhstan | 99.8 /100 | #68 | Exceptional 2.3% |
| Carpatho Rusyns | 99.8 /100 | #69 | Exceptional 2.3% |
| Lithuanians | 99.8 /100 | #70 | Exceptional 2.3% |
| Immigrants | Bolivia | 99.8 /100 | #71 | Exceptional 2.3% |
| Immigrants | Canada | 99.8 /100 | #72 | Exceptional 2.3% |
| Immigrants | Bulgaria | 99.8 /100 | #73 | Exceptional 2.3% |
| Immigrants | North America | 99.8 /100 | #74 | Exceptional 2.2% |
| Immigrants | Western Asia | 99.8 /100 | #75 | Exceptional 2.2% |
| Immigrants | Hungary | 99.8 /100 | #76 | Exceptional 2.2% |
| Immigrants | Lebanon | 99.8 /100 | #77 | Exceptional 2.2% |
| Immigrants | Belarus | 99.7 /100 | #78 | Exceptional 2.2% |