Immigrants from Hong Kong vs Immigrants from Bolivia 10th Grade
COMPARE
Immigrants from Hong Kong
Immigrants from Bolivia
10th Grade
10th Grade Comparison
Immigrants from Hong Kong
Immigrants from Bolivia
93.1%
10TH GRADE
4.2/ 100
METRIC RATING
240th/ 347
METRIC RANK
92.7%
10TH GRADE
0.7/ 100
METRIC RATING
255th/ 347
METRIC RANK
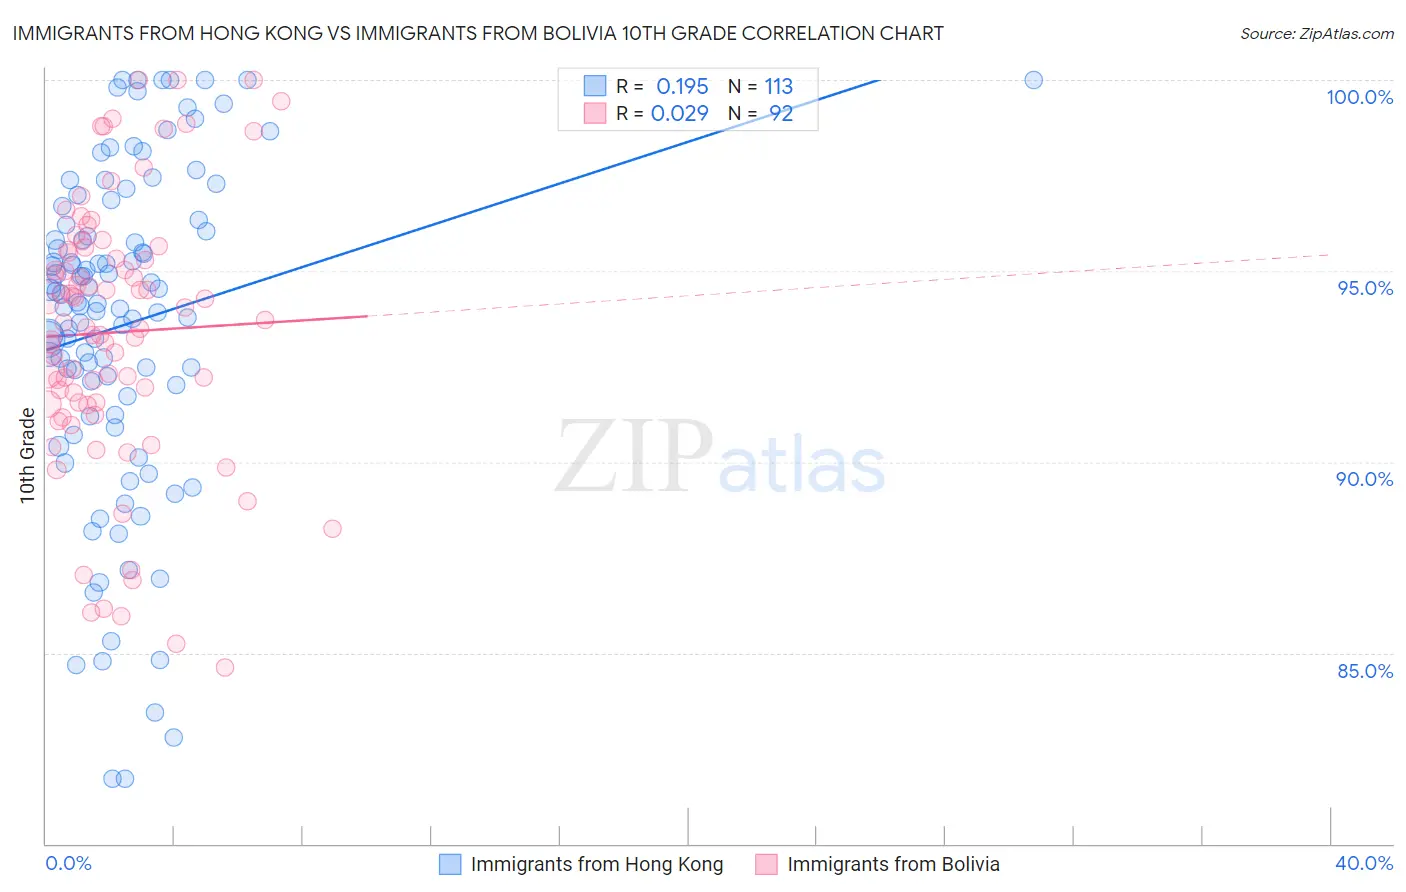
Immigrants from Hong Kong vs Immigrants from Bolivia 10th Grade Correlation Chart
The statistical analysis conducted on geographies consisting of 253,990,382 people shows a poor positive correlation between the proportion of Immigrants from Hong Kong and percentage of population with at least 10th grade education in the United States with a correlation coefficient (R) of 0.195 and weighted average of 93.1%. Similarly, the statistical analysis conducted on geographies consisting of 158,717,902 people shows no correlation between the proportion of Immigrants from Bolivia and percentage of population with at least 10th grade education in the United States with a correlation coefficient (R) of 0.029 and weighted average of 92.7%, a difference of 0.41%.
10th Grade Correlation Summary
| Measurement | Immigrants from Hong Kong | Immigrants from Bolivia |
| Minimum | 81.7% | 84.6% |
| Maximum | 100.0% | 100.0% |
| Range | 18.3% | 15.4% |
| Mean | 93.6% | 93.4% |
| Median | 94.2% | 93.6% |
| Interquartile 25% (IQ1) | 91.5% | 91.5% |
| Interquartile 75% (IQ3) | 96.3% | 95.5% |
| Interquartile Range (IQR) | 4.8% | 4.0% |
| Standard Deviation (Sample) | 4.3% | 3.5% |
| Standard Deviation (Population) | 4.3% | 3.5% |
Demographics Similar to Immigrants from Hong Kong and Immigrants from Bolivia by 10th Grade
In terms of 10th grade, the demographic groups most similar to Immigrants from Hong Kong are Nigerian (93.1%, a difference of 0.0%), Costa Rican (93.1%, a difference of 0.0%), Immigrants from Panama (93.1%, a difference of 0.010%), Immigrants from Somalia (93.0%, a difference of 0.10%), and Immigrants from Cameroon (93.0%, a difference of 0.11%). Similarly, the demographic groups most similar to Immigrants from Bolivia are Immigrants from Nigeria (92.7%, a difference of 0.010%), U.S. Virgin Islander (92.7%, a difference of 0.020%), Armenian (92.7%, a difference of 0.050%), South American (92.8%, a difference of 0.060%), and Ghanaian (92.8%, a difference of 0.060%).
| Demographics | Rating | Rank | 10th Grade |
| Immigrants | Panama | 4.3 /100 | #237 | Tragic 93.1% |
| Nigerians | 4.2 /100 | #238 | Tragic 93.1% |
| Costa Ricans | 4.2 /100 | #239 | Tragic 93.1% |
| Immigrants | Hong Kong | 4.2 /100 | #240 | Tragic 93.1% |
| Immigrants | Somalia | 2.7 /100 | #241 | Tragic 93.0% |
| Immigrants | Cameroon | 2.6 /100 | #242 | Tragic 93.0% |
| Senegalese | 2.4 /100 | #243 | Tragic 93.0% |
| Spanish Americans | 2.1 /100 | #244 | Tragic 92.9% |
| Uruguayans | 1.8 /100 | #245 | Tragic 92.9% |
| Immigrants | Middle Africa | 1.7 /100 | #246 | Tragic 92.9% |
| Immigrants | Afghanistan | 1.4 /100 | #247 | Tragic 92.8% |
| Colombians | 1.4 /100 | #248 | Tragic 92.8% |
| Immigrants | Senegal | 1.4 /100 | #249 | Tragic 92.8% |
| Jamaicans | 1.2 /100 | #250 | Tragic 92.8% |
| Immigrants | Thailand | 1.0 /100 | #251 | Tragic 92.8% |
| South Americans | 0.9 /100 | #252 | Tragic 92.8% |
| Ghanaians | 0.9 /100 | #253 | Tragic 92.8% |
| Armenians | 0.9 /100 | #254 | Tragic 92.7% |
| Immigrants | Bolivia | 0.7 /100 | #255 | Tragic 92.7% |
| Immigrants | Nigeria | 0.7 /100 | #256 | Tragic 92.7% |
| U.S. Virgin Islanders | 0.7 /100 | #257 | Tragic 92.7% |