Canadian vs Immigrants from Belize 11th Grade
COMPARE
Canadian
Immigrants from Belize
11th Grade
11th Grade Comparison
Canadians
Immigrants from Belize
93.7%
11TH GRADE
99.5/ 100
METRIC RATING
80th/ 347
METRIC RANK
88.7%
11TH GRADE
0.0/ 100
METRIC RATING
321st/ 347
METRIC RANK
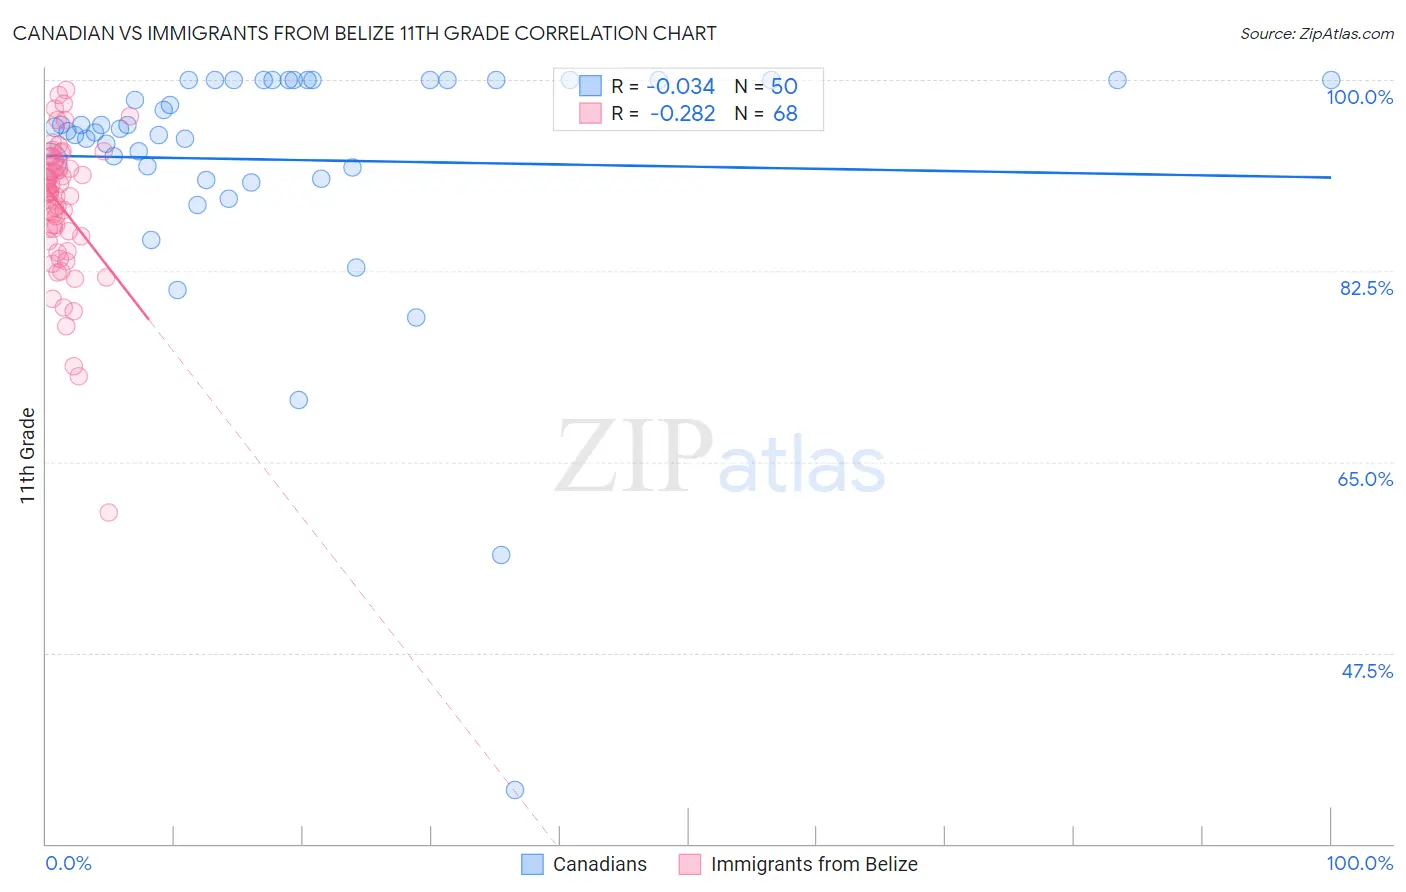
Canadian vs Immigrants from Belize 11th Grade Correlation Chart
The statistical analysis conducted on geographies consisting of 437,556,598 people shows no correlation between the proportion of Canadians and percentage of population with at least 11th grade education in the United States with a correlation coefficient (R) of -0.034 and weighted average of 93.7%. Similarly, the statistical analysis conducted on geographies consisting of 130,181,087 people shows a weak negative correlation between the proportion of Immigrants from Belize and percentage of population with at least 11th grade education in the United States with a correlation coefficient (R) of -0.282 and weighted average of 88.7%, a difference of 5.7%.
11th Grade Correlation Summary
| Measurement | Canadian | Immigrants from Belize |
| Minimum | 34.9% | 60.4% |
| Maximum | 100.0% | 99.1% |
| Range | 65.1% | 38.7% |
| Mean | 92.7% | 88.4% |
| Median | 95.6% | 89.7% |
| Interquartile 25% (IQ1) | 92.0% | 85.5% |
| Interquartile 75% (IQ3) | 100.0% | 92.2% |
| Interquartile Range (IQR) | 8.0% | 6.7% |
| Standard Deviation (Sample) | 11.7% | 6.5% |
| Standard Deviation (Population) | 11.6% | 6.5% |
Similar Demographics by 11th Grade
Demographics Similar to Canadians by 11th Grade
In terms of 11th grade, the demographic groups most similar to Canadians are Immigrants from Moldova (93.7%, a difference of 0.0%), Immigrants from Denmark (93.7%, a difference of 0.020%), Celtic (93.7%, a difference of 0.030%), Aleut (93.7%, a difference of 0.030%), and Soviet Union (93.7%, a difference of 0.030%).
| Demographics | Rating | Rank | 11th Grade |
| Romanians | 99.6 /100 | #73 | Exceptional 93.8% |
| Immigrants | Czechoslovakia | 99.6 /100 | #74 | Exceptional 93.8% |
| Immigrants | Latvia | 99.6 /100 | #75 | Exceptional 93.8% |
| Celtics | 99.5 /100 | #76 | Exceptional 93.7% |
| Aleuts | 99.5 /100 | #77 | Exceptional 93.7% |
| Soviet Union | 99.5 /100 | #78 | Exceptional 93.7% |
| Immigrants | Denmark | 99.5 /100 | #79 | Exceptional 93.7% |
| Canadians | 99.5 /100 | #80 | Exceptional 93.7% |
| Immigrants | Moldova | 99.5 /100 | #81 | Exceptional 93.7% |
| Immigrants | Saudi Arabia | 99.3 /100 | #82 | Exceptional 93.7% |
| Icelanders | 99.3 /100 | #83 | Exceptional 93.6% |
| Immigrants | Taiwan | 99.3 /100 | #84 | Exceptional 93.6% |
| Immigrants | Switzerland | 99.3 /100 | #85 | Exceptional 93.6% |
| Immigrants | South Central Asia | 99.2 /100 | #86 | Exceptional 93.6% |
| Immigrants | Western Europe | 99.2 /100 | #87 | Exceptional 93.6% |
Demographics Similar to Immigrants from Belize by 11th Grade
In terms of 11th grade, the demographic groups most similar to Immigrants from Belize are Immigrants from Armenia (88.8%, a difference of 0.090%), Belizean (88.8%, a difference of 0.11%), Nicaraguan (88.9%, a difference of 0.20%), Lumbee (88.9%, a difference of 0.26%), and Immigrants from Cuba (88.9%, a difference of 0.27%).
| Demographics | Rating | Rank | 11th Grade |
| Cape Verdeans | 0.0 /100 | #314 | Tragic 89.1% |
| Immigrants | Ecuador | 0.0 /100 | #315 | Tragic 89.1% |
| Immigrants | Cuba | 0.0 /100 | #316 | Tragic 88.9% |
| Lumbee | 0.0 /100 | #317 | Tragic 88.9% |
| Nicaraguans | 0.0 /100 | #318 | Tragic 88.9% |
| Belizeans | 0.0 /100 | #319 | Tragic 88.8% |
| Immigrants | Armenia | 0.0 /100 | #320 | Tragic 88.8% |
| Immigrants | Belize | 0.0 /100 | #321 | Tragic 88.7% |
| Puerto Ricans | 0.0 /100 | #322 | Tragic 88.4% |
| Pima | 0.0 /100 | #323 | Tragic 88.3% |
| Central American Indians | 0.0 /100 | #324 | Tragic 88.2% |
| Immigrants | Nicaragua | 0.0 /100 | #325 | Tragic 88.1% |
| Dominicans | 0.0 /100 | #326 | Tragic 87.7% |
| Immigrants | Cabo Verde | 0.0 /100 | #327 | Tragic 87.6% |
| Tohono O'odham | 0.0 /100 | #328 | Tragic 87.6% |