Bolivian vs French Canadian Doctorate Degree
COMPARE
Bolivian
French Canadian
Doctorate Degree
Doctorate Degree Comparison
Bolivians
French Canadians
2.4%
DOCTORATE DEGREE
100.0/ 100
METRIC RATING
55th/ 347
METRIC RANK
1.8%
DOCTORATE DEGREE
30.2/ 100
METRIC RATING
189th/ 347
METRIC RANK
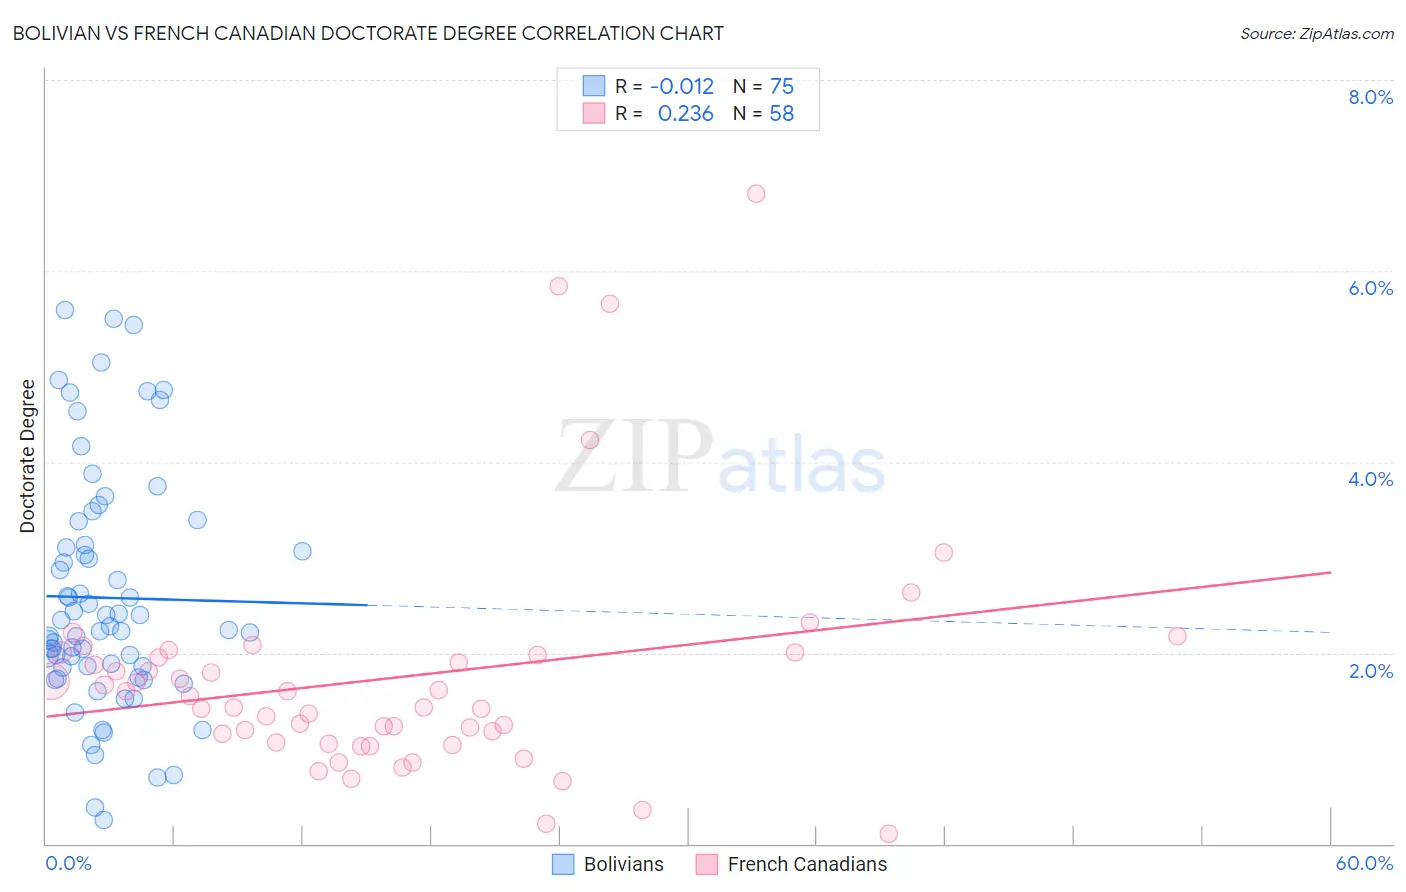
Bolivian vs French Canadian Doctorate Degree Correlation Chart
The statistical analysis conducted on geographies consisting of 184,113,611 people shows no correlation between the proportion of Bolivians and percentage of population with at least doctorate degree education in the United States with a correlation coefficient (R) of -0.012 and weighted average of 2.4%. Similarly, the statistical analysis conducted on geographies consisting of 490,873,037 people shows a weak positive correlation between the proportion of French Canadians and percentage of population with at least doctorate degree education in the United States with a correlation coefficient (R) of 0.236 and weighted average of 1.8%, a difference of 32.7%.
Doctorate Degree Correlation Summary
| Measurement | Bolivian | French Canadian |
| Minimum | 0.25% | 0.11% |
| Maximum | 5.6% | 6.8% |
| Range | 5.3% | 6.7% |
| Mean | 2.6% | 1.7% |
| Median | 2.2% | 1.5% |
| Interquartile 25% (IQ1) | 1.8% | 1.1% |
| Interquartile 75% (IQ3) | 3.1% | 2.0% |
| Interquartile Range (IQR) | 1.3% | 0.92% |
| Standard Deviation (Sample) | 1.2% | 1.2% |
| Standard Deviation (Population) | 1.2% | 1.2% |
Similar Demographics by Doctorate Degree
Demographics Similar to Bolivians by Doctorate Degree
In terms of doctorate degree, the demographic groups most similar to Bolivians are Immigrants from Indonesia (2.4%, a difference of 0.080%), Immigrants from Czechoslovakia (2.4%, a difference of 0.090%), Immigrants from Ethiopia (2.4%, a difference of 0.53%), Ethiopian (2.3%, a difference of 0.65%), and Immigrants from Latvia (2.4%, a difference of 0.76%).
| Demographics | Rating | Rank | Doctorate Degree |
| Asians | 100.0 /100 | #48 | Exceptional 2.4% |
| Immigrants | Asia | 100.0 /100 | #49 | Exceptional 2.4% |
| Immigrants | Norway | 100.0 /100 | #50 | Exceptional 2.4% |
| Australians | 100.0 /100 | #51 | Exceptional 2.4% |
| Bulgarians | 100.0 /100 | #52 | Exceptional 2.4% |
| Immigrants | Latvia | 100.0 /100 | #53 | Exceptional 2.4% |
| Immigrants | Indonesia | 100.0 /100 | #54 | Exceptional 2.4% |
| Bolivians | 100.0 /100 | #55 | Exceptional 2.4% |
| Immigrants | Czechoslovakia | 100.0 /100 | #56 | Exceptional 2.4% |
| Immigrants | Ethiopia | 100.0 /100 | #57 | Exceptional 2.4% |
| Ethiopians | 99.9 /100 | #58 | Exceptional 2.3% |
| South Africans | 99.9 /100 | #59 | Exceptional 2.3% |
| Immigrants | Serbia | 99.9 /100 | #60 | Exceptional 2.3% |
| Bhutanese | 99.9 /100 | #61 | Exceptional 2.3% |
| Immigrants | Europe | 99.9 /100 | #62 | Exceptional 2.3% |
Demographics Similar to French Canadians by Doctorate Degree
In terms of doctorate degree, the demographic groups most similar to French Canadians are Immigrants from Costa Rica (1.8%, a difference of 0.020%), German (1.8%, a difference of 0.040%), South American (1.8%, a difference of 0.13%), Czechoslovakian (1.8%, a difference of 0.49%), and Dutch (1.8%, a difference of 0.52%).
| Demographics | Rating | Rank | Doctorate Degree |
| Immigrants | Afghanistan | 44.3 /100 | #182 | Average 1.8% |
| Finns | 42.1 /100 | #183 | Average 1.8% |
| Nigerians | 39.9 /100 | #184 | Fair 1.8% |
| Slovaks | 36.4 /100 | #185 | Fair 1.8% |
| Peruvians | 34.4 /100 | #186 | Fair 1.8% |
| Czechoslovakians | 33.0 /100 | #187 | Fair 1.8% |
| Germans | 30.5 /100 | #188 | Fair 1.8% |
| French Canadians | 30.2 /100 | #189 | Fair 1.8% |
| Immigrants | Costa Rica | 30.2 /100 | #190 | Fair 1.8% |
| South Americans | 29.5 /100 | #191 | Fair 1.8% |
| Dutch | 27.4 /100 | #192 | Fair 1.8% |
| German Russians | 27.1 /100 | #193 | Fair 1.8% |
| Uruguayans | 26.2 /100 | #194 | Fair 1.8% |
| Immigrants | Somalia | 25.4 /100 | #195 | Fair 1.8% |
| Sub-Saharan Africans | 25.1 /100 | #196 | Fair 1.8% |