Aleut vs Immigrants from Yemen College, Under 1 year
COMPARE
Aleut
Immigrants from Yemen
College, Under 1 year
College, Under 1 year Comparison
Aleuts
Immigrants from Yemen
62.2%
COLLEGE, UNDER 1 YEAR
1.1/ 100
METRIC RATING
240th/ 347
METRIC RANK
55.3%
COLLEGE, UNDER 1 YEAR
0.0/ 100
METRIC RATING
332nd/ 347
METRIC RANK
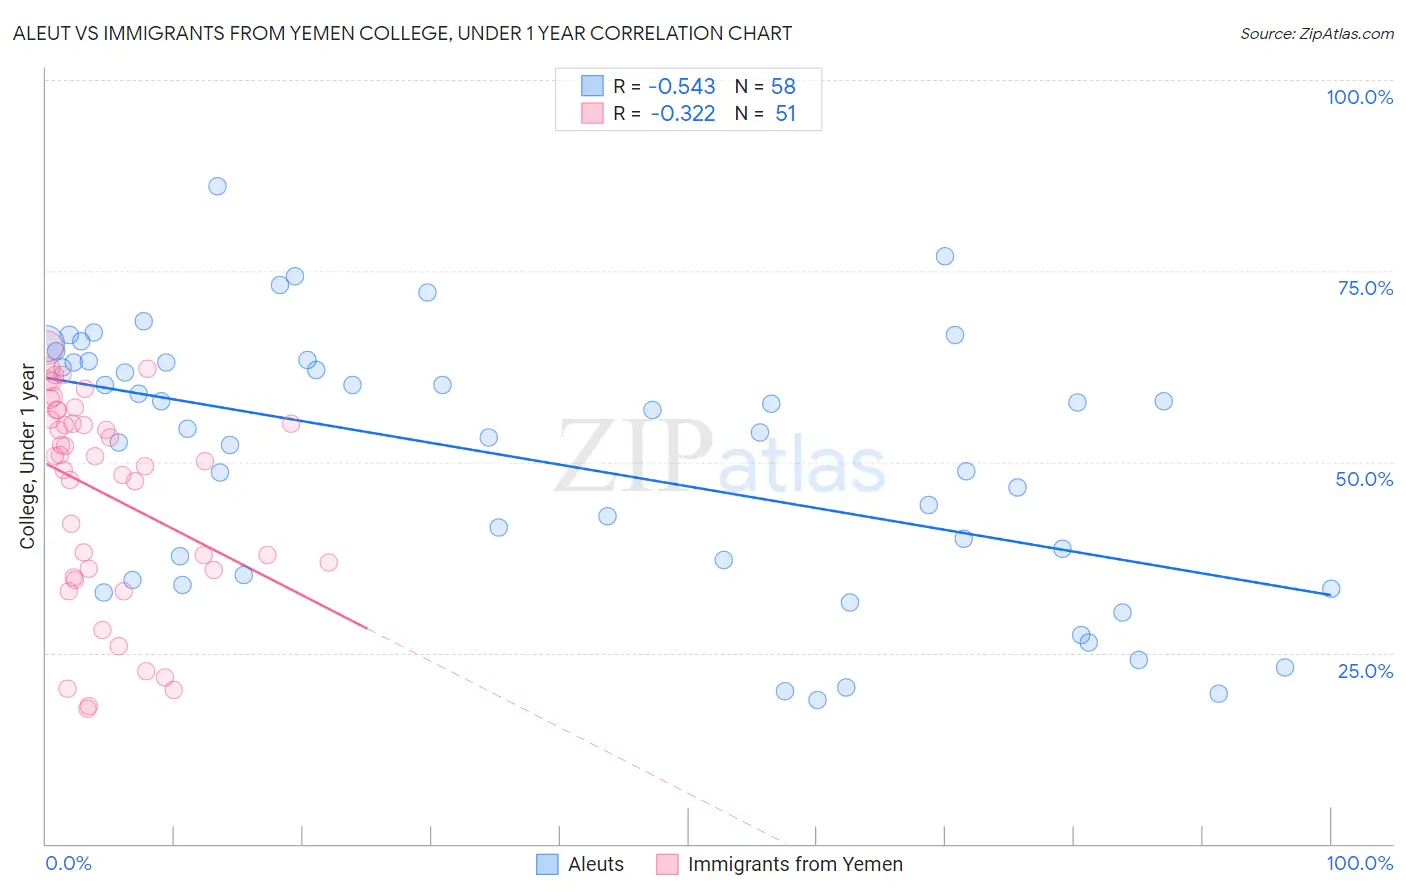
Aleut vs Immigrants from Yemen College, Under 1 year Correlation Chart
The statistical analysis conducted on geographies consisting of 61,782,940 people shows a substantial negative correlation between the proportion of Aleuts and percentage of population with at least college, under 1 year education in the United States with a correlation coefficient (R) of -0.543 and weighted average of 62.2%. Similarly, the statistical analysis conducted on geographies consisting of 82,433,611 people shows a mild negative correlation between the proportion of Immigrants from Yemen and percentage of population with at least college, under 1 year education in the United States with a correlation coefficient (R) of -0.322 and weighted average of 55.3%, a difference of 12.6%.
College, Under 1 year Correlation Summary
| Measurement | Aleut | Immigrants from Yemen |
| Minimum | 18.8% | 17.6% |
| Maximum | 86.1% | 65.0% |
| Range | 67.4% | 47.3% |
| Mean | 50.3% | 45.9% |
| Median | 54.1% | 50.8% |
| Interquartile 25% (IQ1) | 35.3% | 35.8% |
| Interquartile 75% (IQ3) | 63.1% | 56.8% |
| Interquartile Range (IQR) | 27.8% | 21.0% |
| Standard Deviation (Sample) | 16.9% | 13.6% |
| Standard Deviation (Population) | 16.7% | 13.5% |
Similar Demographics by College, Under 1 year
Demographics Similar to Aleuts by College, Under 1 year
In terms of college, under 1 year, the demographic groups most similar to Aleuts are Nepalese (62.2%, a difference of 0.0%), Ottawa (62.2%, a difference of 0.010%), Malaysian (62.2%, a difference of 0.060%), Hawaiian (62.1%, a difference of 0.090%), and Colville (62.1%, a difference of 0.18%).
| Demographics | Rating | Rank | College, Under 1 year |
| Iroquois | 2.0 /100 | #233 | Tragic 62.6% |
| Chippewa | 2.0 /100 | #234 | Tragic 62.6% |
| Spanish Americans | 1.9 /100 | #235 | Tragic 62.6% |
| Immigrants | Immigrants | 1.7 /100 | #236 | Tragic 62.5% |
| Immigrants | Burma/Myanmar | 1.6 /100 | #237 | Tragic 62.5% |
| French American Indians | 1.5 /100 | #238 | Tragic 62.4% |
| Nepalese | 1.1 /100 | #239 | Tragic 62.2% |
| Aleuts | 1.1 /100 | #240 | Tragic 62.2% |
| Ottawa | 1.1 /100 | #241 | Tragic 62.2% |
| Malaysians | 1.1 /100 | #242 | Tragic 62.2% |
| Hawaiians | 1.1 /100 | #243 | Tragic 62.1% |
| Colville | 1.0 /100 | #244 | Tragic 62.1% |
| Delaware | 0.9 /100 | #245 | Tragic 62.1% |
| Marshallese | 0.8 /100 | #246 | Tragic 61.9% |
| Immigrants | Liberia | 0.8 /100 | #247 | Tragic 61.9% |
Demographics Similar to Immigrants from Yemen by College, Under 1 year
In terms of college, under 1 year, the demographic groups most similar to Immigrants from Yemen are Yuman (55.1%, a difference of 0.32%), Dominican (55.5%, a difference of 0.41%), Mexican (55.6%, a difference of 0.67%), Immigrants from Cuba (55.7%, a difference of 0.80%), and Immigrants from the Azores (54.7%, a difference of 1.1%).
| Demographics | Rating | Rank | College, Under 1 year |
| Immigrants | Latin America | 0.0 /100 | #325 | Tragic 56.3% |
| Navajo | 0.0 /100 | #326 | Tragic 56.3% |
| Immigrants | Guatemala | 0.0 /100 | #327 | Tragic 56.2% |
| Cape Verdeans | 0.0 /100 | #328 | Tragic 56.0% |
| Immigrants | Cuba | 0.0 /100 | #329 | Tragic 55.7% |
| Mexicans | 0.0 /100 | #330 | Tragic 55.6% |
| Dominicans | 0.0 /100 | #331 | Tragic 55.5% |
| Immigrants | Yemen | 0.0 /100 | #332 | Tragic 55.3% |
| Yuman | 0.0 /100 | #333 | Tragic 55.1% |
| Immigrants | Azores | 0.0 /100 | #334 | Tragic 54.7% |
| Inupiat | 0.0 /100 | #335 | Tragic 54.6% |
| Pennsylvania Germans | 0.0 /100 | #336 | Tragic 54.5% |
| Immigrants | Central America | 0.0 /100 | #337 | Tragic 54.4% |
| Lumbee | 0.0 /100 | #338 | Tragic 54.2% |
| Immigrants | Dominican Republic | 0.0 /100 | #339 | Tragic 54.0% |