Immigrants from Lithuania vs Immigrants from Yemen College, Under 1 year
COMPARE
Immigrants from Lithuania
Immigrants from Yemen
College, Under 1 year
College, Under 1 year Comparison
Immigrants from Lithuania
Immigrants from Yemen
70.3%
COLLEGE, UNDER 1 YEAR
99.9/ 100
METRIC RATING
42nd/ 347
METRIC RANK
55.3%
COLLEGE, UNDER 1 YEAR
0.0/ 100
METRIC RATING
332nd/ 347
METRIC RANK
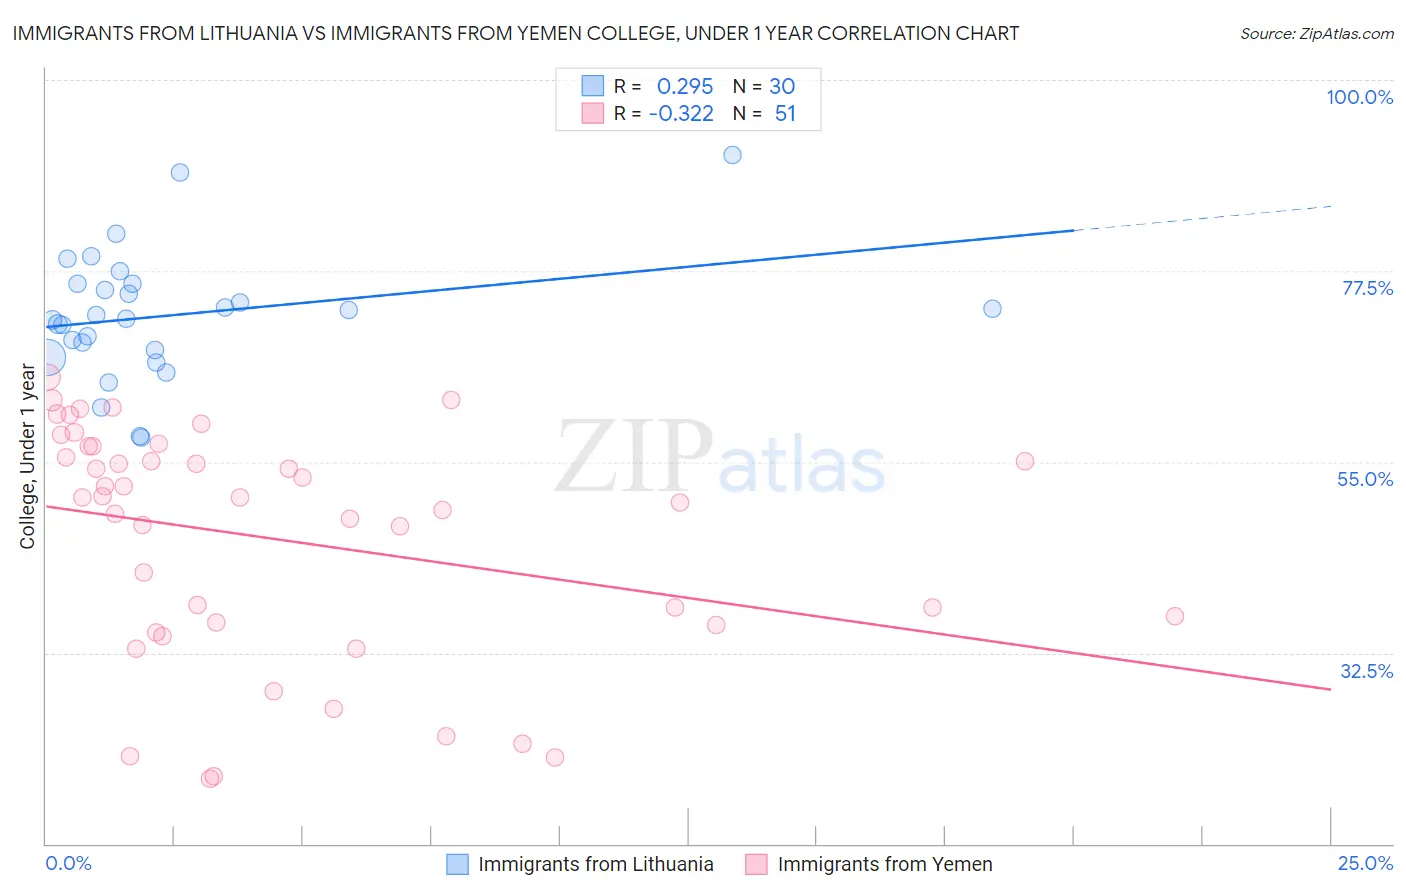
Immigrants from Lithuania vs Immigrants from Yemen College, Under 1 year Correlation Chart
The statistical analysis conducted on geographies consisting of 117,724,932 people shows a weak positive correlation between the proportion of Immigrants from Lithuania and percentage of population with at least college, under 1 year education in the United States with a correlation coefficient (R) of 0.295 and weighted average of 70.3%. Similarly, the statistical analysis conducted on geographies consisting of 82,433,611 people shows a mild negative correlation between the proportion of Immigrants from Yemen and percentage of population with at least college, under 1 year education in the United States with a correlation coefficient (R) of -0.322 and weighted average of 55.3%, a difference of 27.2%.
College, Under 1 year Correlation Summary
| Measurement | Immigrants from Lithuania | Immigrants from Yemen |
| Minimum | 57.9% | 17.6% |
| Maximum | 91.2% | 65.0% |
| Range | 33.3% | 47.3% |
| Mean | 72.3% | 45.9% |
| Median | 72.1% | 50.8% |
| Interquartile 25% (IQ1) | 68.2% | 35.8% |
| Interquartile 75% (IQ3) | 76.0% | 56.8% |
| Interquartile Range (IQR) | 7.8% | 21.0% |
| Standard Deviation (Sample) | 7.5% | 13.6% |
| Standard Deviation (Population) | 7.4% | 13.5% |
Similar Demographics by College, Under 1 year
Demographics Similar to Immigrants from Lithuania by College, Under 1 year
In terms of college, under 1 year, the demographic groups most similar to Immigrants from Lithuania are Immigrants from Kuwait (70.3%, a difference of 0.050%), Israeli (70.2%, a difference of 0.070%), New Zealander (70.2%, a difference of 0.070%), Immigrants from Turkey (70.3%, a difference of 0.090%), and Immigrants from Norway (70.2%, a difference of 0.090%).
| Demographics | Rating | Rank | College, Under 1 year |
| Russians | 99.9 /100 | #35 | Exceptional 70.5% |
| Immigrants | Sri Lanka | 99.9 /100 | #36 | Exceptional 70.5% |
| Immigrants | Saudi Arabia | 99.9 /100 | #37 | Exceptional 70.4% |
| Australians | 99.9 /100 | #38 | Exceptional 70.4% |
| Bhutanese | 99.9 /100 | #39 | Exceptional 70.3% |
| Immigrants | Turkey | 99.9 /100 | #40 | Exceptional 70.3% |
| Immigrants | Kuwait | 99.9 /100 | #41 | Exceptional 70.3% |
| Immigrants | Lithuania | 99.9 /100 | #42 | Exceptional 70.3% |
| Israelis | 99.9 /100 | #43 | Exceptional 70.2% |
| New Zealanders | 99.9 /100 | #44 | Exceptional 70.2% |
| Immigrants | Norway | 99.9 /100 | #45 | Exceptional 70.2% |
| Immigrants | Latvia | 99.9 /100 | #46 | Exceptional 70.1% |
| Immigrants | Bulgaria | 99.8 /100 | #47 | Exceptional 70.0% |
| Immigrants | Netherlands | 99.8 /100 | #48 | Exceptional 70.0% |
| Immigrants | Austria | 99.8 /100 | #49 | Exceptional 70.0% |
Demographics Similar to Immigrants from Yemen by College, Under 1 year
In terms of college, under 1 year, the demographic groups most similar to Immigrants from Yemen are Yuman (55.1%, a difference of 0.32%), Dominican (55.5%, a difference of 0.41%), Mexican (55.6%, a difference of 0.67%), Immigrants from Cuba (55.7%, a difference of 0.80%), and Immigrants from the Azores (54.7%, a difference of 1.1%).
| Demographics | Rating | Rank | College, Under 1 year |
| Immigrants | Latin America | 0.0 /100 | #325 | Tragic 56.3% |
| Navajo | 0.0 /100 | #326 | Tragic 56.3% |
| Immigrants | Guatemala | 0.0 /100 | #327 | Tragic 56.2% |
| Cape Verdeans | 0.0 /100 | #328 | Tragic 56.0% |
| Immigrants | Cuba | 0.0 /100 | #329 | Tragic 55.7% |
| Mexicans | 0.0 /100 | #330 | Tragic 55.6% |
| Dominicans | 0.0 /100 | #331 | Tragic 55.5% |
| Immigrants | Yemen | 0.0 /100 | #332 | Tragic 55.3% |
| Yuman | 0.0 /100 | #333 | Tragic 55.1% |
| Immigrants | Azores | 0.0 /100 | #334 | Tragic 54.7% |
| Inupiat | 0.0 /100 | #335 | Tragic 54.6% |
| Pennsylvania Germans | 0.0 /100 | #336 | Tragic 54.5% |
| Immigrants | Central America | 0.0 /100 | #337 | Tragic 54.4% |
| Lumbee | 0.0 /100 | #338 | Tragic 54.2% |
| Immigrants | Dominican Republic | 0.0 /100 | #339 | Tragic 54.0% |