Aleut vs Immigrants from Yemen No Vehicles in Household
COMPARE
Aleut
Immigrants from Yemen
No Vehicles in Household
No Vehicles in Household Comparison
Aleuts
Immigrants from Yemen
13.0%
NO VEHICLES IN HOUSEHOLD
0.1/ 100
METRIC RATING
277th/ 347
METRIC RANK
19.5%
NO VEHICLES IN HOUSEHOLD
0.0/ 100
METRIC RATING
323rd/ 347
METRIC RANK
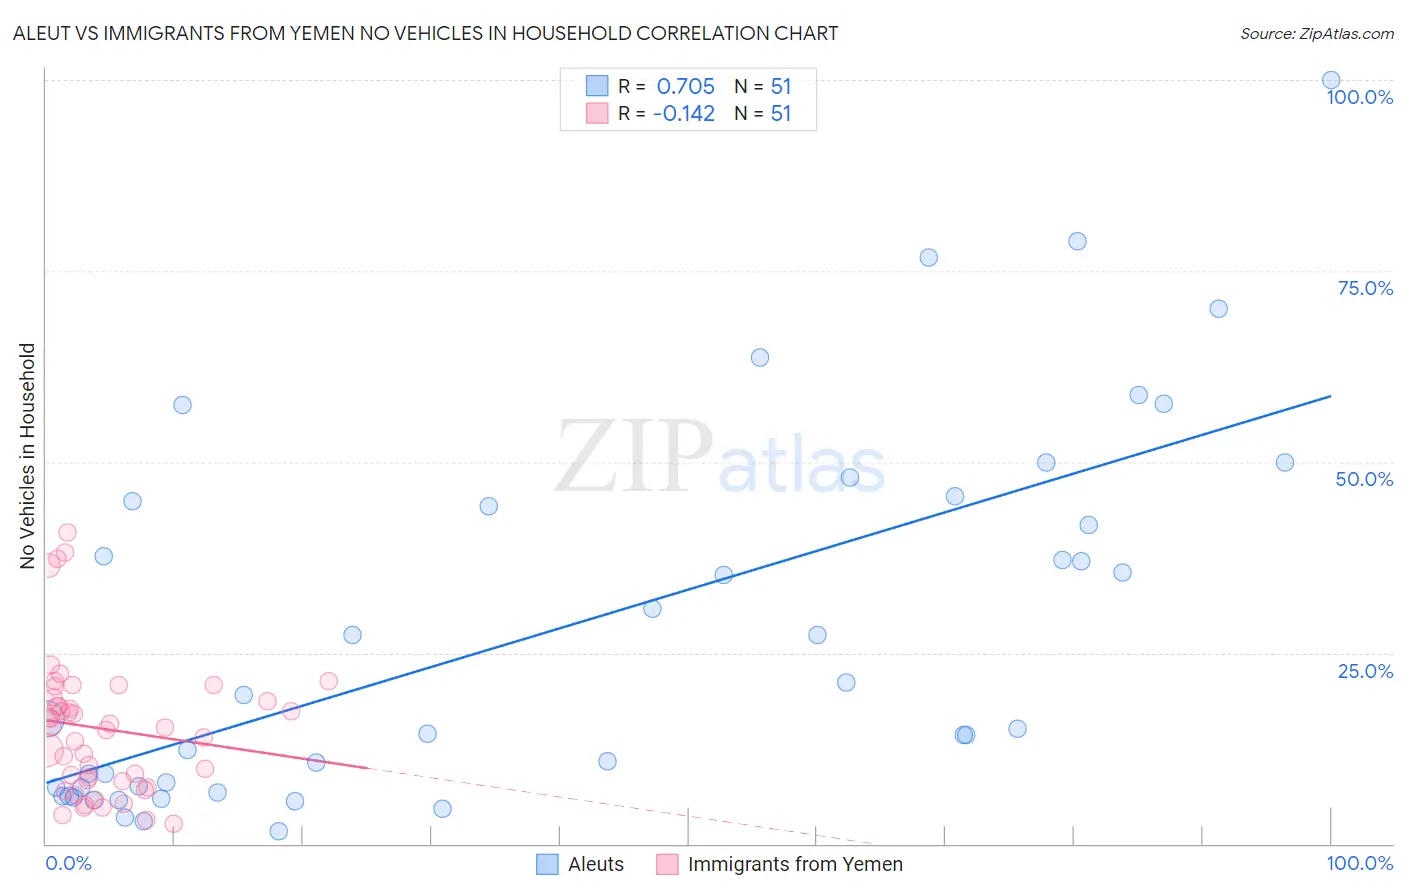
Aleut vs Immigrants from Yemen No Vehicles in Household Correlation Chart
The statistical analysis conducted on geographies consisting of 61,729,503 people shows a strong positive correlation between the proportion of Aleuts and percentage of households with no vehicle available in the United States with a correlation coefficient (R) of 0.705 and weighted average of 13.0%. Similarly, the statistical analysis conducted on geographies consisting of 82,433,611 people shows a poor negative correlation between the proportion of Immigrants from Yemen and percentage of households with no vehicle available in the United States with a correlation coefficient (R) of -0.142 and weighted average of 19.5%, a difference of 49.5%.
No Vehicles in Household Correlation Summary
| Measurement | Aleut | Immigrants from Yemen |
| Minimum | 1.7% | 2.6% |
| Maximum | 100.0% | 40.7% |
| Range | 98.3% | 38.1% |
| Mean | 27.7% | 15.0% |
| Median | 16.4% | 15.2% |
| Interquartile 25% (IQ1) | 7.3% | 8.2% |
| Interquartile 75% (IQ3) | 44.8% | 19.2% |
| Interquartile Range (IQR) | 37.5% | 11.0% |
| Standard Deviation (Sample) | 24.2% | 9.0% |
| Standard Deviation (Population) | 23.9% | 8.9% |
Similar Demographics by No Vehicles in Household
Demographics Similar to Aleuts by No Vehicles in Household
In terms of no vehicles in household, the demographic groups most similar to Aleuts are Immigrants from Croatia (13.0%, a difference of 0.040%), Immigrants from Southern Europe (13.0%, a difference of 0.080%), Immigrants from Albania (13.0%, a difference of 0.44%), Immigrants from Singapore (12.9%, a difference of 0.62%), and Immigrants from France (12.9%, a difference of 0.66%).
| Demographics | Rating | Rank | No Vehicles in Household |
| Immigrants | Northern Africa | 0.2 /100 | #270 | Tragic 12.6% |
| Immigrants | Morocco | 0.2 /100 | #271 | Tragic 12.6% |
| Bermudans | 0.1 /100 | #272 | Tragic 12.8% |
| Immigrants | France | 0.1 /100 | #273 | Tragic 12.9% |
| Immigrants | Singapore | 0.1 /100 | #274 | Tragic 12.9% |
| Immigrants | Albania | 0.1 /100 | #275 | Tragic 13.0% |
| Immigrants | Southern Europe | 0.1 /100 | #276 | Tragic 13.0% |
| Aleuts | 0.1 /100 | #277 | Tragic 13.0% |
| Immigrants | Croatia | 0.1 /100 | #278 | Tragic 13.0% |
| Mongolians | 0.0 /100 | #279 | Tragic 13.1% |
| Alsatians | 0.0 /100 | #280 | Tragic 13.2% |
| Central American Indians | 0.0 /100 | #281 | Tragic 13.3% |
| Immigrants | Eastern Asia | 0.0 /100 | #282 | Tragic 13.5% |
| Immigrants | Kazakhstan | 0.0 /100 | #283 | Tragic 13.6% |
| Immigrants | Malaysia | 0.0 /100 | #284 | Tragic 13.6% |
Demographics Similar to Immigrants from Yemen by No Vehicles in Household
In terms of no vehicles in household, the demographic groups most similar to Immigrants from Yemen are Immigrants from Caribbean (19.6%, a difference of 0.73%), Senegalese (19.8%, a difference of 1.5%), Immigrants from West Indies (20.5%, a difference of 5.5%), Immigrants from Cabo Verde (18.4%, a difference of 5.6%), and Jamaican (17.9%, a difference of 8.6%).
| Demographics | Rating | Rank | No Vehicles in Household |
| Ghanaians | 0.0 /100 | #316 | Tragic 16.4% |
| Immigrants | Ghana | 0.0 /100 | #317 | Tragic 16.6% |
| Immigrants | Belarus | 0.0 /100 | #318 | Tragic 16.7% |
| Alaska Natives | 0.0 /100 | #319 | Tragic 17.4% |
| Soviet Union | 0.0 /100 | #320 | Tragic 17.4% |
| Jamaicans | 0.0 /100 | #321 | Tragic 17.9% |
| Immigrants | Cabo Verde | 0.0 /100 | #322 | Tragic 18.4% |
| Immigrants | Yemen | 0.0 /100 | #323 | Tragic 19.5% |
| Immigrants | Caribbean | 0.0 /100 | #324 | Tragic 19.6% |
| Senegalese | 0.0 /100 | #325 | Tragic 19.8% |
| Immigrants | West Indies | 0.0 /100 | #326 | Tragic 20.5% |
| Immigrants | Senegal | 0.0 /100 | #327 | Tragic 21.1% |
| Immigrants | Dominica | 0.0 /100 | #328 | Tragic 22.2% |
| Ecuadorians | 0.0 /100 | #329 | Tragic 22.8% |
| West Indians | 0.0 /100 | #330 | Tragic 23.7% |