Immigrants from El Salvador vs Cape Verdean Master's Degree
COMPARE
Immigrants from El Salvador
Cape Verdean
Master's Degree
Master's Degree Comparison
Immigrants from El Salvador
Cape Verdeans
12.0%
MASTER'S DEGREE
0.2/ 100
METRIC RATING
282nd/ 347
METRIC RANK
12.1%
MASTER'S DEGREE
0.3/ 100
METRIC RATING
274th/ 347
METRIC RANK
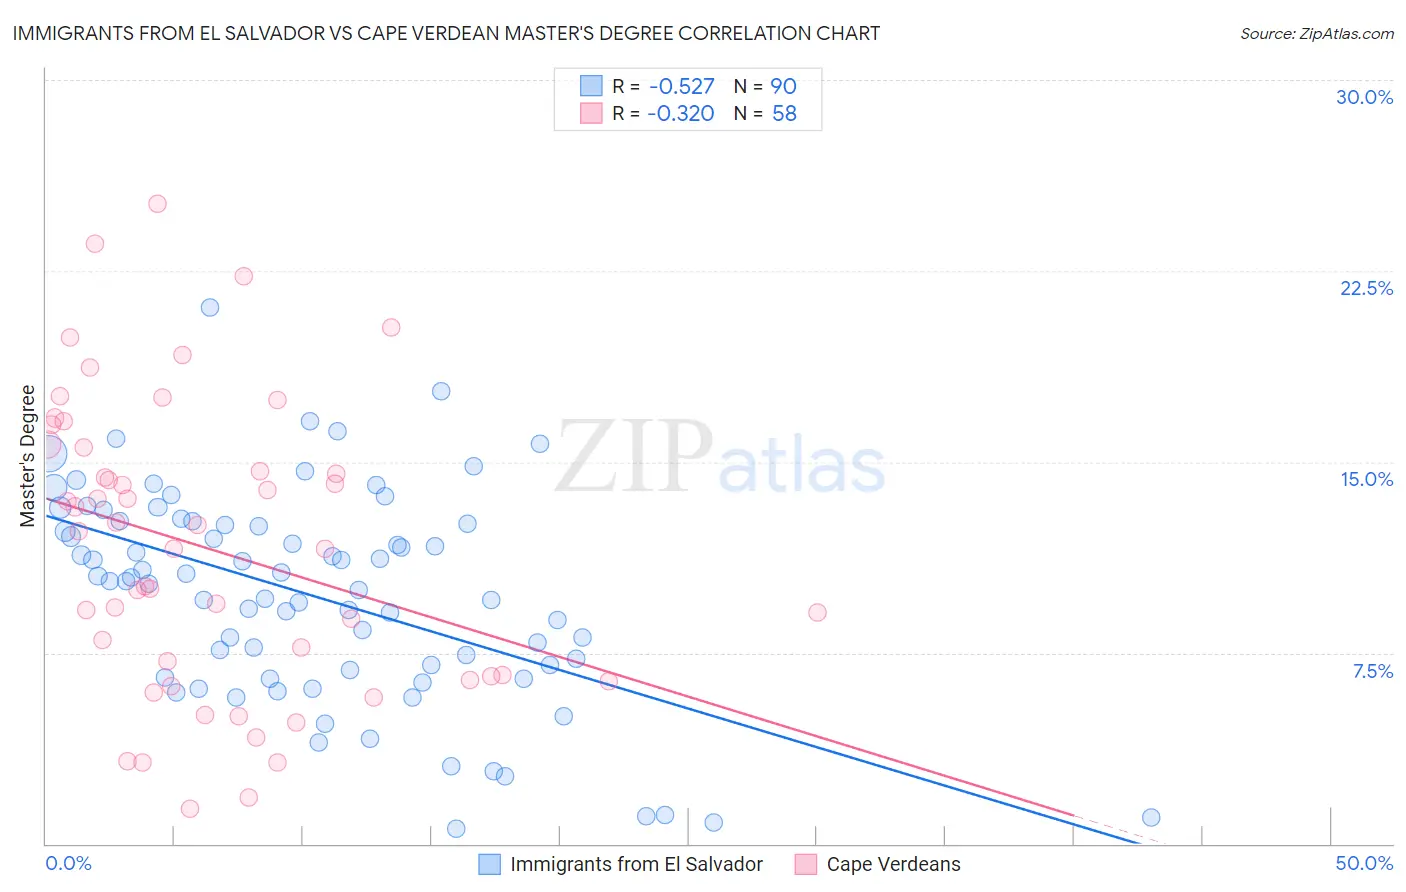
Immigrants from El Salvador vs Cape Verdean Master's Degree Correlation Chart
The statistical analysis conducted on geographies consisting of 357,699,051 people shows a substantial negative correlation between the proportion of Immigrants from El Salvador and percentage of population with at least master's degree education in the United States with a correlation coefficient (R) of -0.527 and weighted average of 12.0%. Similarly, the statistical analysis conducted on geographies consisting of 107,570,267 people shows a mild negative correlation between the proportion of Cape Verdeans and percentage of population with at least master's degree education in the United States with a correlation coefficient (R) of -0.320 and weighted average of 12.1%, a difference of 0.65%.
Master's Degree Correlation Summary
| Measurement | Immigrants from El Salvador | Cape Verdean |
| Minimum | 0.61% | 1.4% |
| Maximum | 21.1% | 25.1% |
| Range | 20.5% | 23.8% |
| Mean | 9.7% | 11.6% |
| Median | 10.3% | 11.9% |
| Interquartile 25% (IQ1) | 6.8% | 6.6% |
| Interquartile 75% (IQ3) | 12.5% | 15.6% |
| Interquartile Range (IQR) | 5.7% | 9.0% |
| Standard Deviation (Sample) | 4.1% | 5.7% |
| Standard Deviation (Population) | 4.1% | 5.7% |
Demographics Similar to Immigrants from El Salvador and Cape Verdeans by Master's Degree
In terms of master's degree, the demographic groups most similar to Immigrants from El Salvador are Malaysian (12.0%, a difference of 0.31%), Honduran (11.9%, a difference of 0.41%), Immigrants from Dominican Republic (12.1%, a difference of 0.44%), Immigrants from Belize (12.1%, a difference of 0.49%), and Potawatomi (12.1%, a difference of 0.57%). Similarly, the demographic groups most similar to Cape Verdeans are Cuban (12.1%, a difference of 0.020%), Black/African American (12.1%, a difference of 0.070%), Immigrants from Caribbean (12.1%, a difference of 0.080%), Potawatomi (12.1%, a difference of 0.080%), and Blackfeet (12.1%, a difference of 0.090%).
| Demographics | Rating | Rank | Master's Degree |
| Native Hawaiians | 0.4 /100 | #268 | Tragic 12.3% |
| Central Americans | 0.3 /100 | #269 | Tragic 12.2% |
| Salvadorans | 0.3 /100 | #270 | Tragic 12.2% |
| Haitians | 0.3 /100 | #271 | Tragic 12.1% |
| Comanche | 0.3 /100 | #272 | Tragic 12.1% |
| Blackfeet | 0.3 /100 | #273 | Tragic 12.1% |
| Cape Verdeans | 0.3 /100 | #274 | Tragic 12.1% |
| Cubans | 0.3 /100 | #275 | Tragic 12.1% |
| Blacks/African Americans | 0.3 /100 | #276 | Tragic 12.1% |
| Immigrants | Caribbean | 0.3 /100 | #277 | Tragic 12.1% |
| Potawatomi | 0.3 /100 | #278 | Tragic 12.1% |
| Immigrants | Belize | 0.2 /100 | #279 | Tragic 12.1% |
| Immigrants | Dominican Republic | 0.2 /100 | #280 | Tragic 12.1% |
| Malaysians | 0.2 /100 | #281 | Tragic 12.0% |
| Immigrants | El Salvador | 0.2 /100 | #282 | Tragic 12.0% |
| Hondurans | 0.2 /100 | #283 | Tragic 11.9% |
| Ottawa | 0.2 /100 | #284 | Tragic 11.9% |
| Immigrants | Nicaragua | 0.2 /100 | #285 | Tragic 11.8% |
| Aleuts | 0.1 /100 | #286 | Tragic 11.8% |
| Immigrants | Haiti | 0.1 /100 | #287 | Tragic 11.8% |
| Immigrants | Honduras | 0.1 /100 | #288 | Tragic 11.8% |