Aleut vs Cape Verdean Disability Age 65 to 74
COMPARE
Aleut
Cape Verdean
Disability Age 65 to 74
Disability Age 65 to 74 Comparison
Aleuts
Cape Verdeans
28.4%
DISABILITY AGE 65 TO 74
0.0/ 100
METRIC RATING
322nd/ 347
METRIC RANK
25.4%
DISABILITY AGE 65 TO 74
0.2/ 100
METRIC RATING
261st/ 347
METRIC RANK
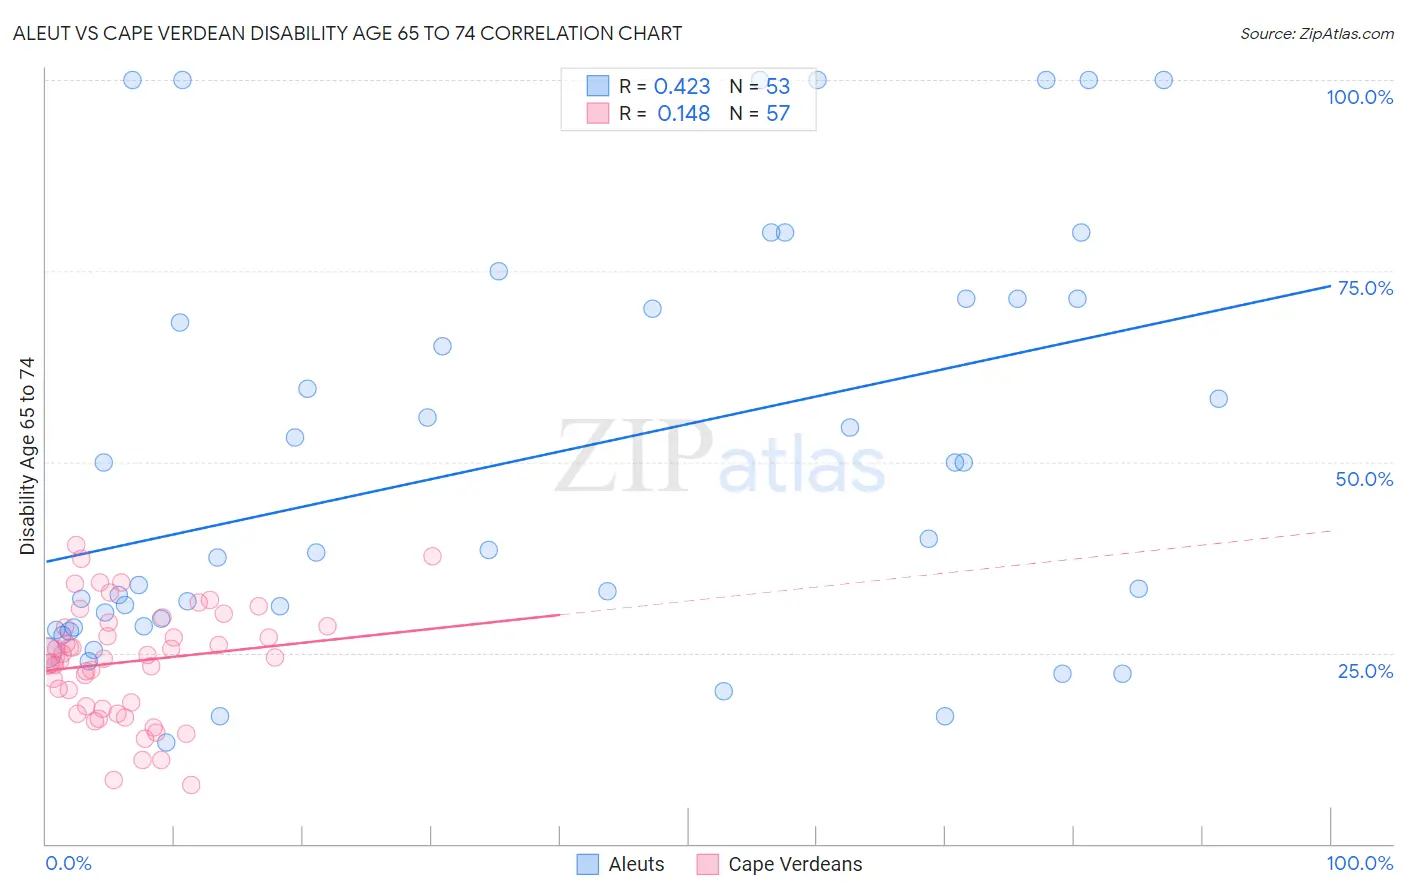
Aleut vs Cape Verdean Disability Age 65 to 74 Correlation Chart
The statistical analysis conducted on geographies consisting of 61,757,238 people shows a moderate positive correlation between the proportion of Aleuts and percentage of population with a disability between the ages 65 and 75 in the United States with a correlation coefficient (R) of 0.423 and weighted average of 28.4%. Similarly, the statistical analysis conducted on geographies consisting of 107,487,290 people shows a poor positive correlation between the proportion of Cape Verdeans and percentage of population with a disability between the ages 65 and 75 in the United States with a correlation coefficient (R) of 0.148 and weighted average of 25.4%, a difference of 11.9%.
Disability Age 65 to 74 Correlation Summary
| Measurement | Aleut | Cape Verdean |
| Minimum | 13.2% | 7.7% |
| Maximum | 100.0% | 39.2% |
| Range | 86.8% | 31.5% |
| Mean | 50.2% | 23.8% |
| Median | 38.5% | 24.3% |
| Interquartile 25% (IQ1) | 28.4% | 17.8% |
| Interquartile 75% (IQ3) | 71.4% | 28.7% |
| Interquartile Range (IQR) | 43.0% | 10.9% |
| Standard Deviation (Sample) | 26.9% | 7.3% |
| Standard Deviation (Population) | 26.6% | 7.3% |
Similar Demographics by Disability Age 65 to 74
Demographics Similar to Aleuts by Disability Age 65 to 74
In terms of disability age 65 to 74, the demographic groups most similar to Aleuts are Comanche (28.3%, a difference of 0.33%), Cherokee (28.2%, a difference of 0.84%), Arapaho (28.1%, a difference of 1.2%), Nepalese (28.0%, a difference of 1.5%), and Immigrants from Armenia (28.0%, a difference of 1.7%).
| Demographics | Rating | Rank | Disability Age 65 to 74 |
| Cajuns | 0.0 /100 | #315 | Tragic 27.9% |
| Crow | 0.0 /100 | #316 | Tragic 27.9% |
| Immigrants | Armenia | 0.0 /100 | #317 | Tragic 28.0% |
| Nepalese | 0.0 /100 | #318 | Tragic 28.0% |
| Arapaho | 0.0 /100 | #319 | Tragic 28.1% |
| Cherokee | 0.0 /100 | #320 | Tragic 28.2% |
| Comanche | 0.0 /100 | #321 | Tragic 28.3% |
| Aleuts | 0.0 /100 | #322 | Tragic 28.4% |
| Puerto Ricans | 0.0 /100 | #323 | Tragic 29.1% |
| Seminole | 0.0 /100 | #324 | Tragic 29.4% |
| Dutch West Indians | 0.0 /100 | #325 | Tragic 29.6% |
| Yakama | 0.0 /100 | #326 | Tragic 29.6% |
| Apache | 0.0 /100 | #327 | Tragic 29.7% |
| Hopi | 0.0 /100 | #328 | Tragic 30.0% |
| Choctaw | 0.0 /100 | #329 | Tragic 30.2% |
Demographics Similar to Cape Verdeans by Disability Age 65 to 74
In terms of disability age 65 to 74, the demographic groups most similar to Cape Verdeans are Malaysian (25.4%, a difference of 0.080%), Samoan (25.4%, a difference of 0.10%), Iroquois (25.4%, a difference of 0.10%), Immigrants from Cambodia (25.3%, a difference of 0.40%), and Hawaiian (25.5%, a difference of 0.45%).
| Demographics | Rating | Rank | Disability Age 65 to 74 |
| Somalis | 0.6 /100 | #254 | Tragic 25.1% |
| Central Americans | 0.5 /100 | #255 | Tragic 25.1% |
| Immigrants | Somalia | 0.4 /100 | #256 | Tragic 25.2% |
| Guamanians/Chamorros | 0.3 /100 | #257 | Tragic 25.3% |
| Marshallese | 0.3 /100 | #258 | Tragic 25.3% |
| Immigrants | Cambodia | 0.3 /100 | #259 | Tragic 25.3% |
| Malaysians | 0.2 /100 | #260 | Tragic 25.4% |
| Cape Verdeans | 0.2 /100 | #261 | Tragic 25.4% |
| Samoans | 0.2 /100 | #262 | Tragic 25.4% |
| Iroquois | 0.2 /100 | #263 | Tragic 25.4% |
| Hawaiians | 0.2 /100 | #264 | Tragic 25.5% |
| Guatemalans | 0.2 /100 | #265 | Tragic 25.5% |
| Immigrants | Latin America | 0.1 /100 | #266 | Tragic 25.6% |
| Ottawa | 0.1 /100 | #267 | Tragic 25.6% |
| Liberians | 0.1 /100 | #268 | Tragic 25.6% |