Maltese vs Immigrants from Sudan 8th Grade
COMPARE
Maltese
Immigrants from Sudan
8th Grade
8th Grade Comparison
Maltese
Immigrants from Sudan
96.9%
8TH GRADE
99.9/ 100
METRIC RATING
44th/ 347
METRIC RANK
95.5%
8TH GRADE
15.1/ 100
METRIC RATING
207th/ 347
METRIC RANK
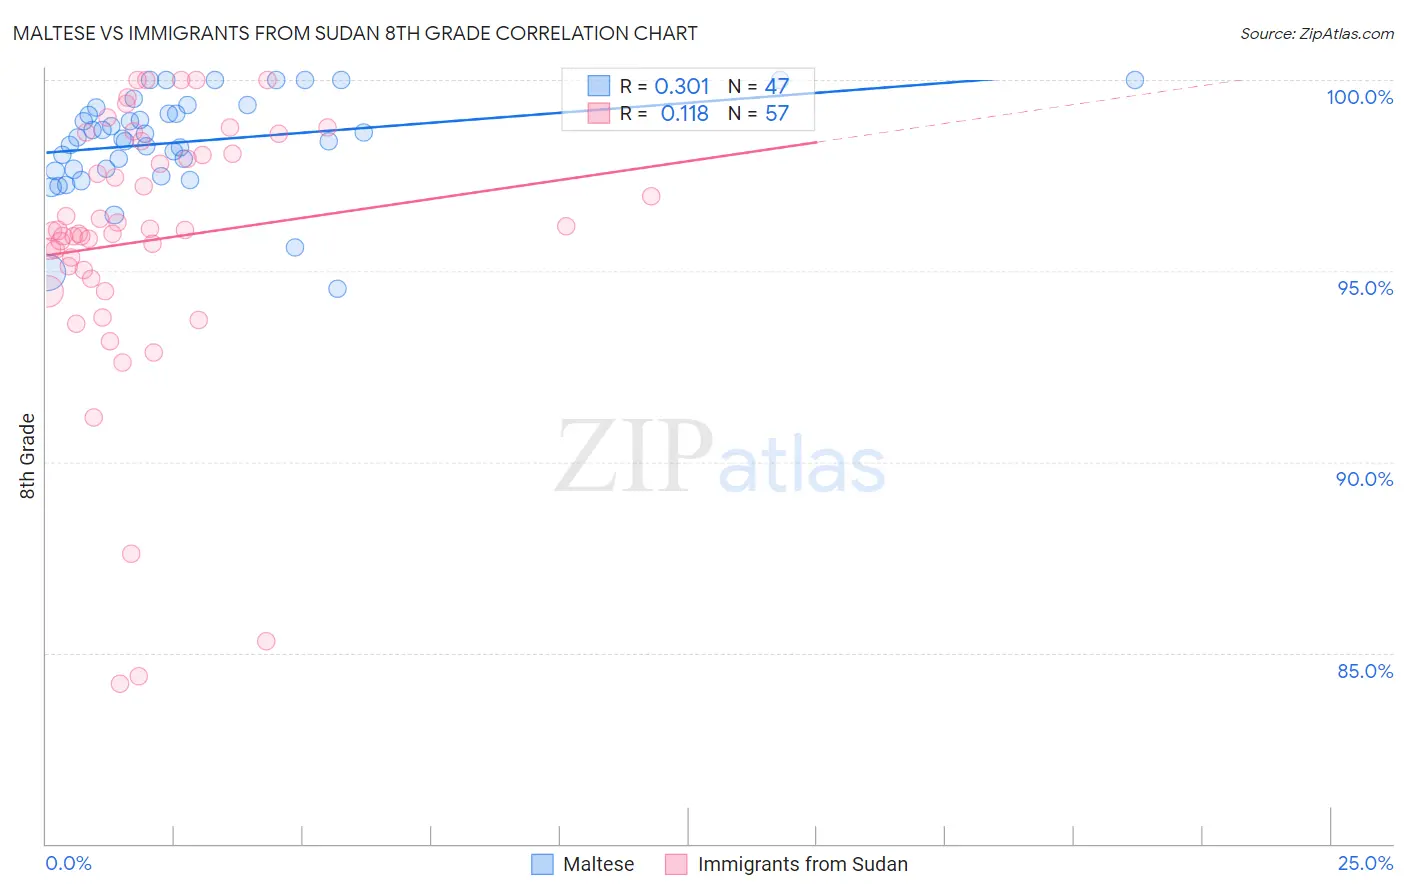
Maltese vs Immigrants from Sudan 8th Grade Correlation Chart
The statistical analysis conducted on geographies consisting of 126,476,608 people shows a mild positive correlation between the proportion of Maltese and percentage of population with at least 8th grade education in the United States with a correlation coefficient (R) of 0.301 and weighted average of 96.9%. Similarly, the statistical analysis conducted on geographies consisting of 118,959,807 people shows a poor positive correlation between the proportion of Immigrants from Sudan and percentage of population with at least 8th grade education in the United States with a correlation coefficient (R) of 0.118 and weighted average of 95.5%, a difference of 1.5%.
8th Grade Correlation Summary
| Measurement | Maltese | Immigrants from Sudan |
| Minimum | 94.5% | 84.2% |
| Maximum | 100.0% | 100.0% |
| Range | 5.5% | 15.8% |
| Mean | 98.4% | 95.8% |
| Median | 98.5% | 96.1% |
| Interquartile 25% (IQ1) | 97.7% | 94.9% |
| Interquartile 75% (IQ3) | 99.3% | 98.2% |
| Interquartile Range (IQR) | 1.6% | 3.3% |
| Standard Deviation (Sample) | 1.3% | 3.6% |
| Standard Deviation (Population) | 1.3% | 3.5% |
Similar Demographics by 8th Grade
Demographics Similar to Maltese by 8th Grade
In terms of 8th grade, the demographic groups most similar to Maltese are Northern European (96.9%, a difference of 0.0%), Czechoslovakian (96.9%, a difference of 0.010%), Aleut (96.9%, a difference of 0.020%), Bulgarian (96.9%, a difference of 0.020%), and Chinese (96.9%, a difference of 0.050%).
| Demographics | Rating | Rank | 8th Grade |
| Latvians | 100.0 /100 | #37 | Exceptional 97.0% |
| British | 100.0 /100 | #38 | Exceptional 97.0% |
| Hungarians | 100.0 /100 | #39 | Exceptional 97.0% |
| Inupiat | 100.0 /100 | #40 | Exceptional 97.0% |
| Eastern Europeans | 100.0 /100 | #41 | Exceptional 97.0% |
| Chinese | 100.0 /100 | #42 | Exceptional 96.9% |
| Aleuts | 99.9 /100 | #43 | Exceptional 96.9% |
| Maltese | 99.9 /100 | #44 | Exceptional 96.9% |
| Northern Europeans | 99.9 /100 | #45 | Exceptional 96.9% |
| Czechoslovakians | 99.9 /100 | #46 | Exceptional 96.9% |
| Bulgarians | 99.9 /100 | #47 | Exceptional 96.9% |
| Slavs | 99.9 /100 | #48 | Exceptional 96.8% |
| Estonians | 99.9 /100 | #49 | Exceptional 96.8% |
| Immigrants | Scotland | 99.9 /100 | #50 | Exceptional 96.8% |
| Celtics | 99.9 /100 | #51 | Exceptional 96.8% |
Demographics Similar to Immigrants from Sudan by 8th Grade
In terms of 8th grade, the demographic groups most similar to Immigrants from Sudan are Portuguese (95.5%, a difference of 0.010%), Hawaiian (95.5%, a difference of 0.020%), Immigrants from Bahamas (95.5%, a difference of 0.020%), Comanche (95.5%, a difference of 0.020%), and Immigrants from Lebanon (95.4%, a difference of 0.020%).
| Demographics | Rating | Rank | 8th Grade |
| Argentineans | 22.2 /100 | #200 | Fair 95.5% |
| Immigrants | Argentina | 20.6 /100 | #201 | Fair 95.5% |
| Apache | 19.4 /100 | #202 | Poor 95.5% |
| Moroccans | 17.4 /100 | #203 | Poor 95.5% |
| Hawaiians | 16.7 /100 | #204 | Poor 95.5% |
| Immigrants | Bahamas | 16.7 /100 | #205 | Poor 95.5% |
| Comanche | 16.3 /100 | #206 | Poor 95.5% |
| Immigrants | Sudan | 15.1 /100 | #207 | Poor 95.5% |
| Portuguese | 14.3 /100 | #208 | Poor 95.5% |
| Immigrants | Lebanon | 13.7 /100 | #209 | Poor 95.4% |
| Africans | 13.6 /100 | #210 | Poor 95.4% |
| Immigrants | Morocco | 12.4 /100 | #211 | Poor 95.4% |
| Immigrants | Pakistan | 9.7 /100 | #212 | Tragic 95.4% |
| Laotians | 9.0 /100 | #213 | Tragic 95.4% |
| Immigrants | Chile | 9.0 /100 | #214 | Tragic 95.4% |