Albanian vs British West Indian Child Poverty Under the Age of 16
COMPARE
Albanian
British West Indian
Child Poverty Under the Age of 16
Child Poverty Under the Age of 16 Comparison
Albanians
British West Indians
15.2%
CHILD POVERTY UNDER THE AGE OF 16
88.6/ 100
METRIC RATING
135th/ 347
METRIC RANK
21.3%
CHILD POVERTY UNDER THE AGE OF 16
0.0/ 100
METRIC RATING
308th/ 347
METRIC RANK
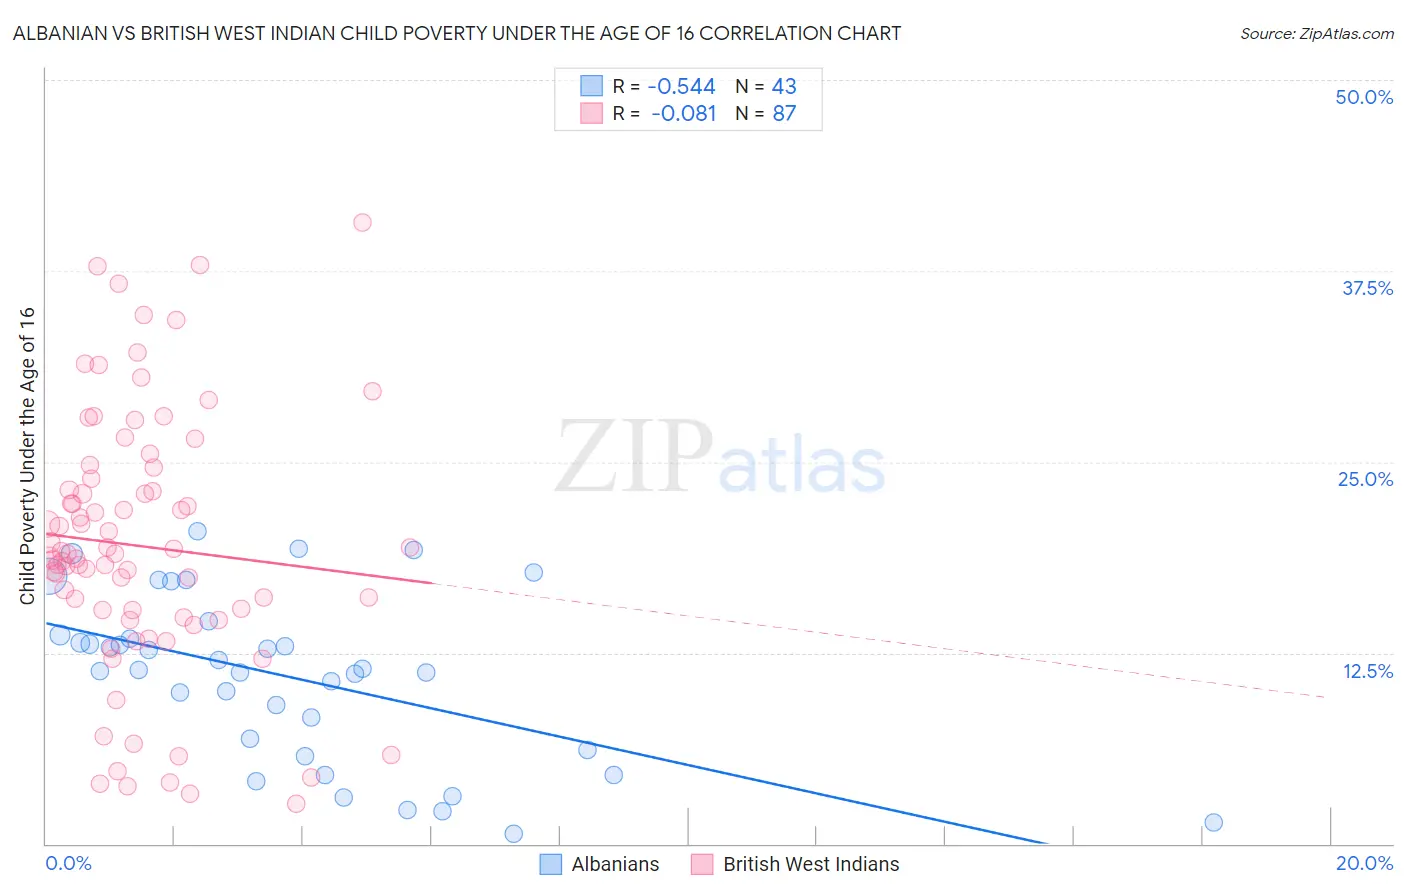
Albanian vs British West Indian Child Poverty Under the Age of 16 Correlation Chart
The statistical analysis conducted on geographies consisting of 191,955,882 people shows a substantial negative correlation between the proportion of Albanians and poverty level among children under the age of 16 in the United States with a correlation coefficient (R) of -0.544 and weighted average of 15.2%. Similarly, the statistical analysis conducted on geographies consisting of 152,192,070 people shows a slight negative correlation between the proportion of British West Indians and poverty level among children under the age of 16 in the United States with a correlation coefficient (R) of -0.081 and weighted average of 21.3%, a difference of 40.2%.
Child Poverty Under the Age of 16 Correlation Summary
| Measurement | Albanian | British West Indian |
| Minimum | 0.69% | 2.6% |
| Maximum | 20.5% | 40.6% |
| Range | 19.8% | 38.1% |
| Mean | 10.9% | 19.5% |
| Median | 11.4% | 19.0% |
| Interquartile 25% (IQ1) | 6.1% | 14.8% |
| Interquartile 75% (IQ3) | 13.6% | 23.9% |
| Interquartile Range (IQR) | 7.5% | 9.1% |
| Standard Deviation (Sample) | 5.4% | 8.5% |
| Standard Deviation (Population) | 5.4% | 8.5% |
Similar Demographics by Child Poverty Under the Age of 16
Demographics Similar to Albanians by Child Poverty Under the Age of 16
In terms of child poverty under the age of 16, the demographic groups most similar to Albanians are Native Hawaiian (15.2%, a difference of 0.040%), Immigrants from South Eastern Asia (15.2%, a difference of 0.13%), Canadian (15.2%, a difference of 0.18%), Armenian (15.2%, a difference of 0.27%), and Mongolian (15.2%, a difference of 0.30%).
| Demographics | Rating | Rank | Child Poverty Under the Age of 16 |
| Immigrants | Kazakhstan | 90.2 /100 | #128 | Exceptional 15.1% |
| Immigrants | Southern Europe | 89.7 /100 | #129 | Excellent 15.1% |
| Mongolians | 89.5 /100 | #130 | Excellent 15.2% |
| Armenians | 89.4 /100 | #131 | Excellent 15.2% |
| Canadians | 89.1 /100 | #132 | Excellent 15.2% |
| Immigrants | South Eastern Asia | 89.0 /100 | #133 | Excellent 15.2% |
| Native Hawaiians | 88.7 /100 | #134 | Excellent 15.2% |
| Albanians | 88.6 /100 | #135 | Excellent 15.2% |
| Immigrants | Spain | 87.3 /100 | #136 | Excellent 15.3% |
| Peruvians | 87.2 /100 | #137 | Excellent 15.3% |
| Welsh | 87.2 /100 | #138 | Excellent 15.3% |
| Immigrants | Vietnam | 87.1 /100 | #139 | Excellent 15.3% |
| New Zealanders | 86.9 /100 | #140 | Excellent 15.3% |
| Slavs | 84.2 /100 | #141 | Excellent 15.4% |
| Brazilians | 82.8 /100 | #142 | Excellent 15.4% |
Demographics Similar to British West Indians by Child Poverty Under the Age of 16
In terms of child poverty under the age of 16, the demographic groups most similar to British West Indians are Immigrants from Central America (21.3%, a difference of 0.29%), Immigrants from Mexico (21.5%, a difference of 0.65%), Bahamian (21.5%, a difference of 0.67%), Guatemalan (21.2%, a difference of 0.70%), and Dutch West Indian (21.5%, a difference of 0.76%).
| Demographics | Rating | Rank | Child Poverty Under the Age of 16 |
| Immigrants | Grenada | 0.0 /100 | #301 | Tragic 21.0% |
| Immigrants | Bahamas | 0.0 /100 | #302 | Tragic 21.0% |
| Choctaw | 0.0 /100 | #303 | Tragic 21.0% |
| Somalis | 0.0 /100 | #304 | Tragic 21.0% |
| Seminole | 0.0 /100 | #305 | Tragic 21.1% |
| Guatemalans | 0.0 /100 | #306 | Tragic 21.2% |
| Immigrants | Central America | 0.0 /100 | #307 | Tragic 21.3% |
| British West Indians | 0.0 /100 | #308 | Tragic 21.3% |
| Immigrants | Mexico | 0.0 /100 | #309 | Tragic 21.5% |
| Bahamians | 0.0 /100 | #310 | Tragic 21.5% |
| Dutch West Indians | 0.0 /100 | #311 | Tragic 21.5% |
| Ute | 0.0 /100 | #312 | Tragic 21.5% |
| Creek | 0.0 /100 | #313 | Tragic 21.5% |
| Immigrants | Somalia | 0.0 /100 | #314 | Tragic 21.6% |
| Immigrants | Guatemala | 0.0 /100 | #315 | Tragic 21.6% |