Immigrants from Kenya vs Thai 9th Grade
COMPARE
Immigrants from Kenya
Thai
9th Grade
9th Grade Comparison
Immigrants from Kenya
Thais
95.0%
9TH GRADE
73.1/ 100
METRIC RATING
156th/ 347
METRIC RANK
95.8%
9TH GRADE
99.5/ 100
METRIC RATING
74th/ 347
METRIC RANK
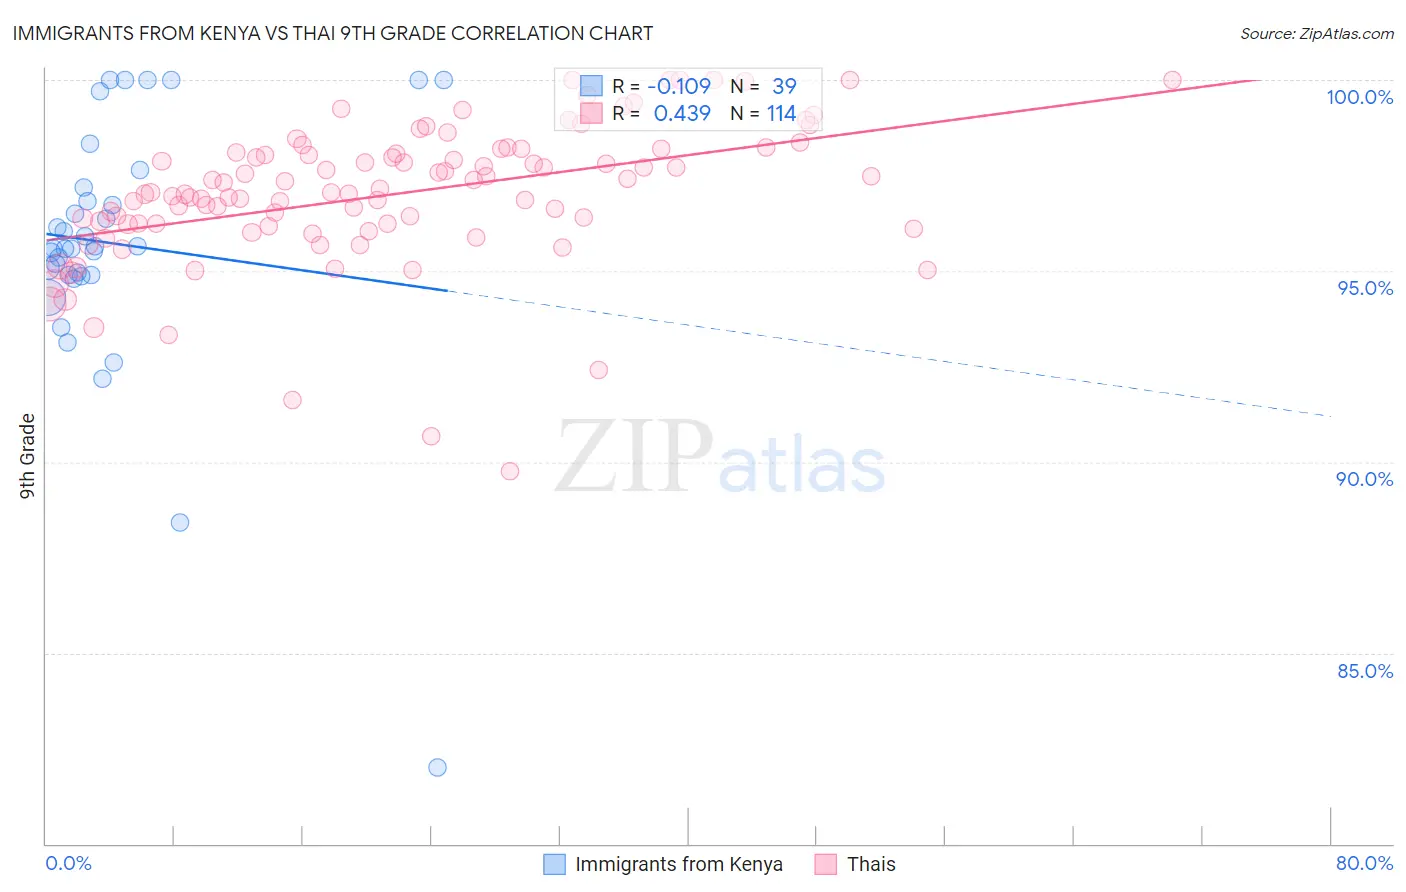
Immigrants from Kenya vs Thai 9th Grade Correlation Chart
The statistical analysis conducted on geographies consisting of 218,076,690 people shows a poor negative correlation between the proportion of Immigrants from Kenya and percentage of population with at least 9th grade education in the United States with a correlation coefficient (R) of -0.109 and weighted average of 95.0%. Similarly, the statistical analysis conducted on geographies consisting of 475,814,962 people shows a moderate positive correlation between the proportion of Thais and percentage of population with at least 9th grade education in the United States with a correlation coefficient (R) of 0.439 and weighted average of 95.8%, a difference of 0.79%.
9th Grade Correlation Summary
| Measurement | Immigrants from Kenya | Thai |
| Minimum | 82.0% | 89.8% |
| Maximum | 100.0% | 100.0% |
| Range | 18.0% | 10.2% |
| Mean | 95.7% | 97.0% |
| Median | 95.6% | 97.0% |
| Interquartile 25% (IQ1) | 94.9% | 96.2% |
| Interquartile 75% (IQ3) | 97.2% | 98.1% |
| Interquartile Range (IQR) | 2.3% | 1.9% |
| Standard Deviation (Sample) | 3.3% | 1.8% |
| Standard Deviation (Population) | 3.3% | 1.8% |
Similar Demographics by 9th Grade
Demographics Similar to Immigrants from Kenya by 9th Grade
In terms of 9th grade, the demographic groups most similar to Immigrants from Kenya are Mongolian (95.0%, a difference of 0.0%), Arab (95.1%, a difference of 0.020%), Immigrants from Kazakhstan (95.1%, a difference of 0.020%), Albanian (95.1%, a difference of 0.030%), and Egyptian (95.0%, a difference of 0.030%).
| Demographics | Rating | Rank | 9th Grade |
| Immigrants | Korea | 79.6 /100 | #149 | Good 95.1% |
| Kenyans | 79.1 /100 | #150 | Good 95.1% |
| Cajuns | 77.3 /100 | #151 | Good 95.1% |
| Ugandans | 77.0 /100 | #152 | Good 95.1% |
| Albanians | 76.1 /100 | #153 | Good 95.1% |
| Arabs | 74.9 /100 | #154 | Good 95.1% |
| Immigrants | Kazakhstan | 74.7 /100 | #155 | Good 95.1% |
| Immigrants | Kenya | 73.1 /100 | #156 | Good 95.0% |
| Mongolians | 73.0 /100 | #157 | Good 95.0% |
| Egyptians | 70.1 /100 | #158 | Good 95.0% |
| Immigrants | Ukraine | 67.4 /100 | #159 | Good 95.0% |
| Immigrants | Italy | 66.6 /100 | #160 | Good 95.0% |
| French American Indians | 66.5 /100 | #161 | Good 95.0% |
| Bermudans | 65.8 /100 | #162 | Good 95.0% |
| Pakistanis | 64.1 /100 | #163 | Good 95.0% |
Demographics Similar to Thais by 9th Grade
In terms of 9th grade, the demographic groups most similar to Thais are Immigrants from Australia (95.8%, a difference of 0.010%), Immigrants from Belgium (95.8%, a difference of 0.010%), Turkish (95.8%, a difference of 0.010%), Immigrants from Singapore (95.8%, a difference of 0.010%), and Inupiat (95.8%, a difference of 0.010%).
| Demographics | Rating | Rank | 9th Grade |
| Cypriots | 99.6 /100 | #67 | Exceptional 95.8% |
| Immigrants | Ireland | 99.6 /100 | #68 | Exceptional 95.8% |
| Immigrants | Lithuania | 99.6 /100 | #69 | Exceptional 95.8% |
| Immigrants | Australia | 99.5 /100 | #70 | Exceptional 95.8% |
| Immigrants | Belgium | 99.5 /100 | #71 | Exceptional 95.8% |
| Turks | 99.5 /100 | #72 | Exceptional 95.8% |
| Immigrants | Singapore | 99.5 /100 | #73 | Exceptional 95.8% |
| Thais | 99.5 /100 | #74 | Exceptional 95.8% |
| Inupiat | 99.5 /100 | #75 | Exceptional 95.8% |
| Immigrants | Sweden | 99.5 /100 | #76 | Exceptional 95.8% |
| Whites/Caucasians | 99.4 /100 | #77 | Exceptional 95.8% |
| Immigrants | South Africa | 99.4 /100 | #78 | Exceptional 95.8% |
| Romanians | 99.3 /100 | #79 | Exceptional 95.7% |
| Bhutanese | 99.3 /100 | #80 | Exceptional 95.7% |
| Arapaho | 99.3 /100 | #81 | Exceptional 95.7% |