Palestinian vs Immigrants from Iran Professional Degree
COMPARE
Palestinian
Immigrants from Iran
Professional Degree
Professional Degree Comparison
Palestinians
Immigrants from Iran
4.8%
PROFESSIONAL DEGREE
91.5/ 100
METRIC RATING
129th/ 347
METRIC RANK
7.3%
PROFESSIONAL DEGREE
100.0/ 100
METRIC RATING
5th/ 347
METRIC RANK
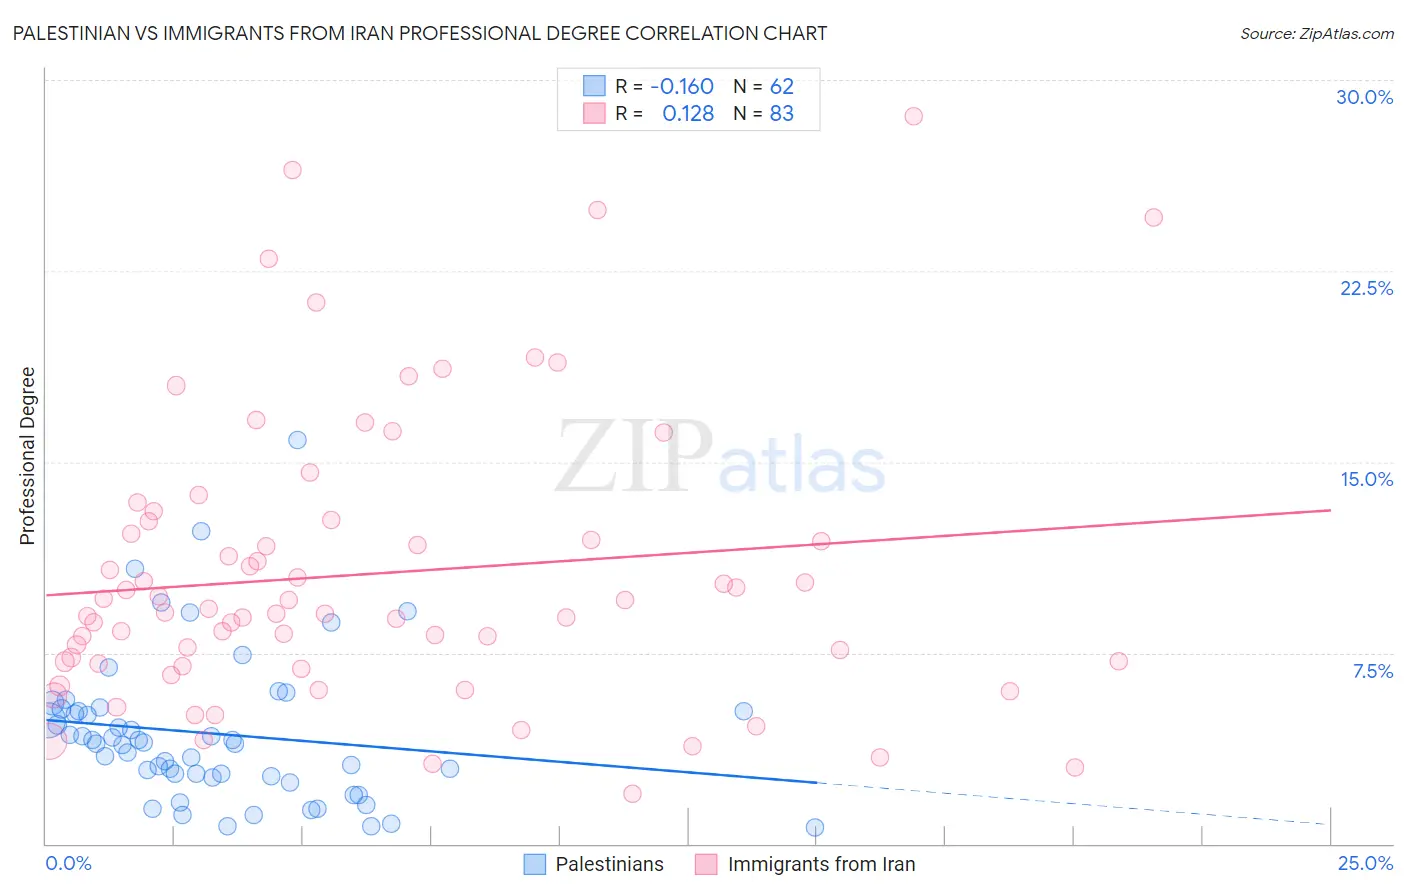
Palestinian vs Immigrants from Iran Professional Degree Correlation Chart
The statistical analysis conducted on geographies consisting of 216,348,582 people shows a poor negative correlation between the proportion of Palestinians and percentage of population with at least professional degree education in the United States with a correlation coefficient (R) of -0.160 and weighted average of 4.8%. Similarly, the statistical analysis conducted on geographies consisting of 279,790,021 people shows a poor positive correlation between the proportion of Immigrants from Iran and percentage of population with at least professional degree education in the United States with a correlation coefficient (R) of 0.128 and weighted average of 7.3%, a difference of 53.0%.
Professional Degree Correlation Summary
| Measurement | Palestinian | Immigrants from Iran |
| Minimum | 0.66% | 1.9% |
| Maximum | 15.9% | 28.6% |
| Range | 15.2% | 26.6% |
| Mean | 4.3% | 10.6% |
| Median | 4.0% | 9.1% |
| Interquartile 25% (IQ1) | 2.6% | 7.1% |
| Interquartile 75% (IQ3) | 5.2% | 12.7% |
| Interquartile Range (IQR) | 2.6% | 5.6% |
| Standard Deviation (Sample) | 2.9% | 5.6% |
| Standard Deviation (Population) | 2.9% | 5.6% |
Similar Demographics by Professional Degree
Demographics Similar to Palestinians by Professional Degree
In terms of professional degree, the demographic groups most similar to Palestinians are Icelander (4.8%, a difference of 0.030%), Immigrants from Nepal (4.8%, a difference of 0.050%), Pakistani (4.8%, a difference of 0.27%), Immigrants from Eastern Africa (4.8%, a difference of 0.46%), and Serbian (4.8%, a difference of 0.48%).
| Demographics | Rating | Rank | Professional Degree |
| Immigrants | Germany | 94.1 /100 | #122 | Exceptional 4.9% |
| Immigrants | Venezuela | 93.8 /100 | #123 | Exceptional 4.8% |
| Immigrants | Eritrea | 93.5 /100 | #124 | Exceptional 4.8% |
| Immigrants | Albania | 93.3 /100 | #125 | Exceptional 4.8% |
| Europeans | 93.2 /100 | #126 | Exceptional 4.8% |
| Serbians | 92.6 /100 | #127 | Exceptional 4.8% |
| Immigrants | Eastern Africa | 92.5 /100 | #128 | Exceptional 4.8% |
| Palestinians | 91.5 /100 | #129 | Exceptional 4.8% |
| Icelanders | 91.5 /100 | #130 | Exceptional 4.8% |
| Immigrants | Nepal | 91.4 /100 | #131 | Exceptional 4.8% |
| Pakistanis | 90.9 /100 | #132 | Exceptional 4.8% |
| Italians | 90.2 /100 | #133 | Exceptional 4.8% |
| South American Indians | 89.9 /100 | #134 | Excellent 4.8% |
| Macedonians | 89.8 /100 | #135 | Excellent 4.8% |
| Immigrants | Jordan | 89.0 /100 | #136 | Excellent 4.7% |
Demographics Similar to Immigrants from Iran by Professional Degree
In terms of professional degree, the demographic groups most similar to Immigrants from Iran are Okinawan (7.3%, a difference of 0.11%), Filipino (7.6%, a difference of 3.2%), Eastern European (7.1%, a difference of 3.3%), Immigrants from Switzerland (7.1%, a difference of 3.4%), and Immigrants from Taiwan (7.1%, a difference of 3.6%).
| Demographics | Rating | Rank | Professional Degree |
| Immigrants | Israel | 100.0 /100 | #1 | Exceptional 7.9% |
| Immigrants | Singapore | 100.0 /100 | #2 | Exceptional 7.7% |
| Iranians | 100.0 /100 | #3 | Exceptional 7.6% |
| Filipinos | 100.0 /100 | #4 | Exceptional 7.6% |
| Immigrants | Iran | 100.0 /100 | #5 | Exceptional 7.3% |
| Okinawans | 100.0 /100 | #6 | Exceptional 7.3% |
| Eastern Europeans | 100.0 /100 | #7 | Exceptional 7.1% |
| Immigrants | Switzerland | 100.0 /100 | #8 | Exceptional 7.1% |
| Immigrants | Taiwan | 100.0 /100 | #9 | Exceptional 7.1% |
| Immigrants | Belgium | 100.0 /100 | #10 | Exceptional 7.0% |
| Cypriots | 100.0 /100 | #11 | Exceptional 6.9% |
| Israelis | 100.0 /100 | #12 | Exceptional 6.9% |
| Immigrants | Australia | 100.0 /100 | #13 | Exceptional 6.9% |
| Immigrants | France | 100.0 /100 | #14 | Exceptional 6.8% |
| Immigrants | China | 100.0 /100 | #15 | Exceptional 6.7% |