Alaskan Athabascan vs Immigrants from Cameroon Professional Degree
COMPARE
Alaskan Athabascan
Immigrants from Cameroon
Professional Degree
Professional Degree Comparison
Alaskan Athabascans
Immigrants from Cameroon
3.8%
PROFESSIONAL DEGREE
2.3/ 100
METRIC RATING
241st/ 347
METRIC RANK
4.3%
PROFESSIONAL DEGREE
33.3/ 100
METRIC RATING
187th/ 347
METRIC RANK
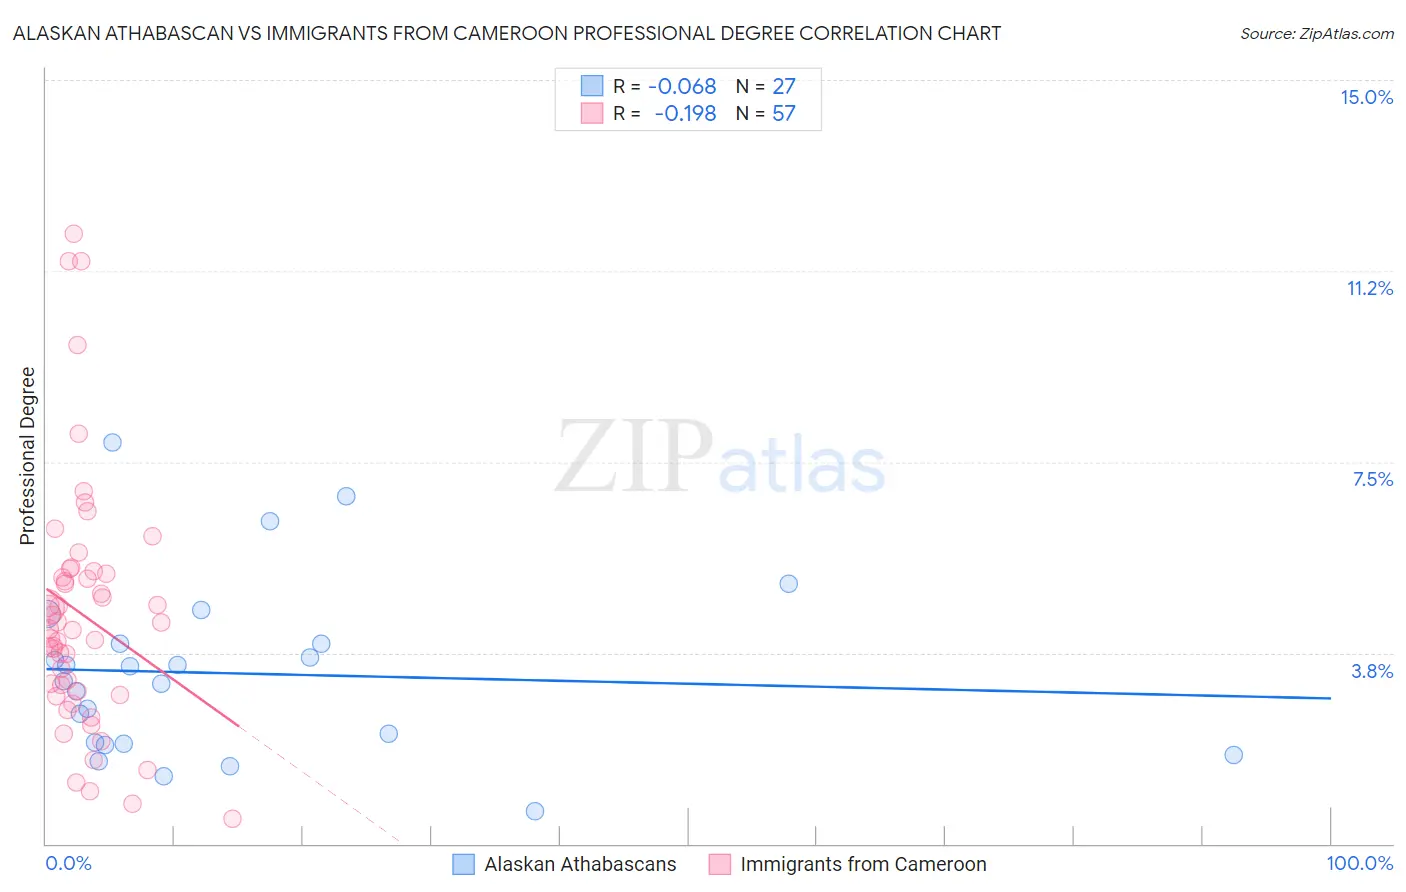
Alaskan Athabascan vs Immigrants from Cameroon Professional Degree Correlation Chart
The statistical analysis conducted on geographies consisting of 45,732,326 people shows a slight negative correlation between the proportion of Alaskan Athabascans and percentage of population with at least professional degree education in the United States with a correlation coefficient (R) of -0.068 and weighted average of 3.8%. Similarly, the statistical analysis conducted on geographies consisting of 130,670,643 people shows a poor negative correlation between the proportion of Immigrants from Cameroon and percentage of population with at least professional degree education in the United States with a correlation coefficient (R) of -0.198 and weighted average of 4.3%, a difference of 12.9%.
Professional Degree Correlation Summary
| Measurement | Alaskan Athabascan | Immigrants from Cameroon |
| Minimum | 0.64% | 0.49% |
| Maximum | 7.9% | 12.0% |
| Range | 7.2% | 11.5% |
| Mean | 3.3% | 4.5% |
| Median | 3.2% | 4.2% |
| Interquartile 25% (IQ1) | 2.0% | 3.0% |
| Interquartile 75% (IQ3) | 3.9% | 5.3% |
| Interquartile Range (IQR) | 2.0% | 2.4% |
| Standard Deviation (Sample) | 1.7% | 2.4% |
| Standard Deviation (Population) | 1.7% | 2.4% |
Similar Demographics by Professional Degree
Demographics Similar to Alaskan Athabascans by Professional Degree
In terms of professional degree, the demographic groups most similar to Alaskan Athabascans are Native Hawaiian (3.8%, a difference of 0.0%), Immigrants from Ecuador (3.8%, a difference of 0.020%), Guamanian/Chamorro (3.8%, a difference of 0.080%), British West Indian (3.8%, a difference of 0.25%), and Immigrants from Bahamas (3.8%, a difference of 0.51%).
| Demographics | Rating | Rank | Professional Degree |
| Immigrants | Nonimmigrants | 4.0 /100 | #234 | Tragic 3.9% |
| Immigrants | Barbados | 4.0 /100 | #235 | Tragic 3.9% |
| Spanish Americans | 3.8 /100 | #236 | Tragic 3.9% |
| Immigrants | Trinidad and Tobago | 3.8 /100 | #237 | Tragic 3.9% |
| Colville | 2.6 /100 | #238 | Tragic 3.8% |
| British West Indians | 2.4 /100 | #239 | Tragic 3.8% |
| Immigrants | Ecuador | 2.3 /100 | #240 | Tragic 3.8% |
| Alaskan Athabascans | 2.3 /100 | #241 | Tragic 3.8% |
| Native Hawaiians | 2.3 /100 | #242 | Tragic 3.8% |
| Guamanians/Chamorros | 2.2 /100 | #243 | Tragic 3.8% |
| Immigrants | Bahamas | 2.0 /100 | #244 | Tragic 3.8% |
| French American Indians | 1.7 /100 | #245 | Tragic 3.8% |
| Marshallese | 1.7 /100 | #246 | Tragic 3.8% |
| Guyanese | 1.6 /100 | #247 | Tragic 3.8% |
| Hmong | 1.6 /100 | #248 | Tragic 3.7% |
Demographics Similar to Immigrants from Cameroon by Professional Degree
In terms of professional degree, the demographic groups most similar to Immigrants from Cameroon are Scotch-Irish (4.3%, a difference of 0.15%), Immigrants from Thailand (4.3%, a difference of 0.28%), Welsh (4.3%, a difference of 0.42%), Slovak (4.3%, a difference of 0.45%), and Belgian (4.3%, a difference of 0.47%).
| Demographics | Rating | Rank | Professional Degree |
| Czechs | 44.9 /100 | #180 | Average 4.4% |
| Danes | 43.5 /100 | #181 | Average 4.4% |
| Immigrants | Immigrants | 43.2 /100 | #182 | Average 4.4% |
| Bermudans | 43.1 /100 | #183 | Average 4.4% |
| Belgians | 36.2 /100 | #184 | Fair 4.3% |
| Welsh | 35.8 /100 | #185 | Fair 4.3% |
| Scotch-Irish | 34.2 /100 | #186 | Fair 4.3% |
| Immigrants | Cameroon | 33.3 /100 | #187 | Fair 4.3% |
| Immigrants | Thailand | 31.7 /100 | #188 | Fair 4.3% |
| Slovaks | 30.7 /100 | #189 | Fair 4.3% |
| Immigrants | Poland | 29.2 /100 | #190 | Fair 4.3% |
| Sri Lankans | 29.0 /100 | #191 | Fair 4.3% |
| Ghanaians | 27.3 /100 | #192 | Fair 4.3% |
| French | 27.1 /100 | #193 | Fair 4.2% |
| Scandinavians | 25.8 /100 | #194 | Fair 4.2% |