Immigrants from Eritrea vs Immigrants from Iran Professional Degree
COMPARE
Immigrants from Eritrea
Immigrants from Iran
Professional Degree
Professional Degree Comparison
Immigrants from Eritrea
Immigrants from Iran
4.8%
PROFESSIONAL DEGREE
93.5/ 100
METRIC RATING
124th/ 347
METRIC RANK
7.3%
PROFESSIONAL DEGREE
100.0/ 100
METRIC RATING
5th/ 347
METRIC RANK
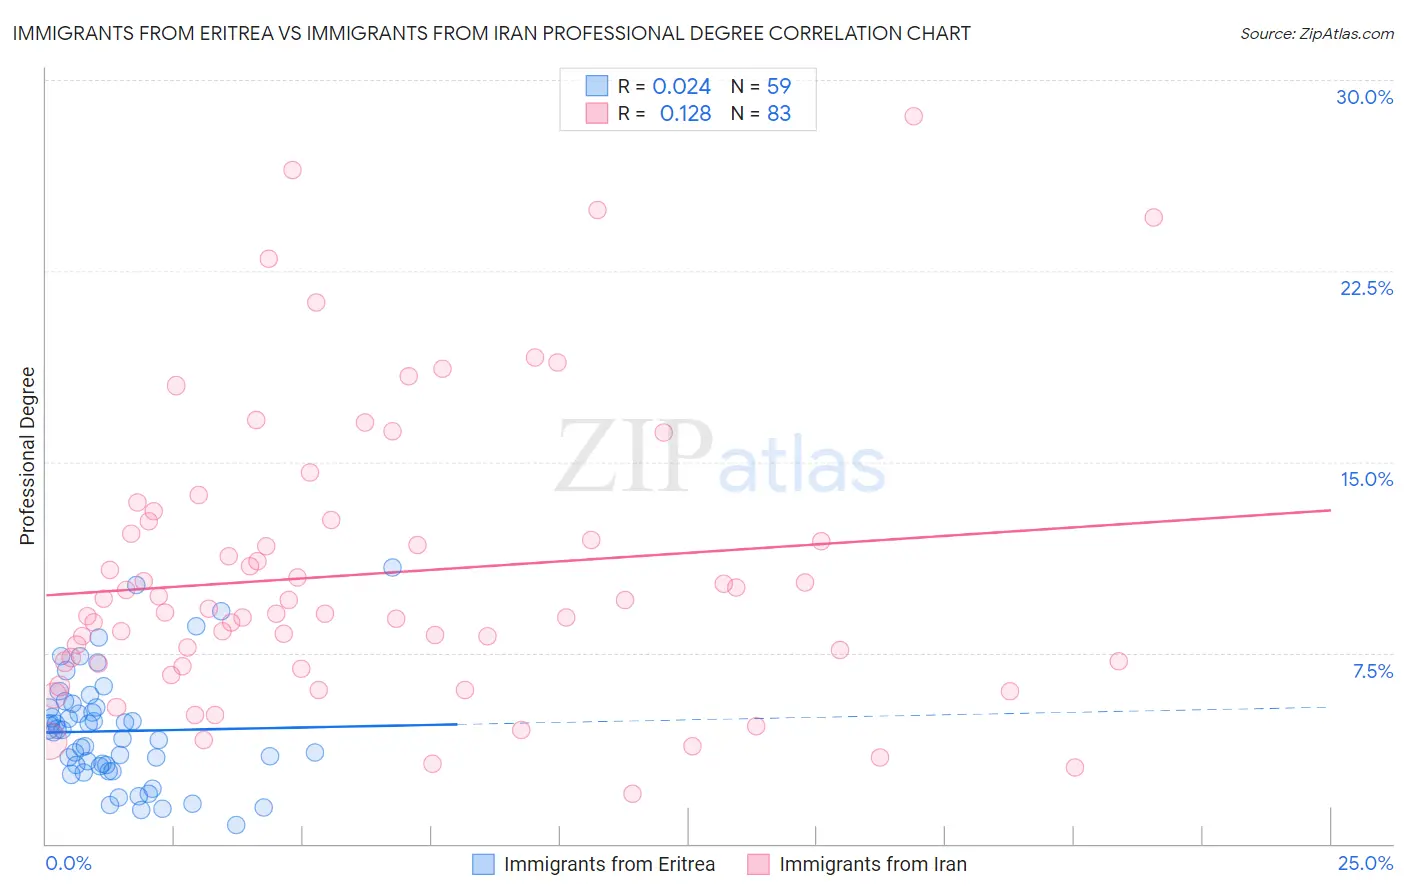
Immigrants from Eritrea vs Immigrants from Iran Professional Degree Correlation Chart
The statistical analysis conducted on geographies consisting of 104,813,744 people shows no correlation between the proportion of Immigrants from Eritrea and percentage of population with at least professional degree education in the United States with a correlation coefficient (R) of 0.024 and weighted average of 4.8%. Similarly, the statistical analysis conducted on geographies consisting of 279,790,021 people shows a poor positive correlation between the proportion of Immigrants from Iran and percentage of population with at least professional degree education in the United States with a correlation coefficient (R) of 0.128 and weighted average of 7.3%, a difference of 51.6%.
Professional Degree Correlation Summary
| Measurement | Immigrants from Eritrea | Immigrants from Iran |
| Minimum | 0.74% | 1.9% |
| Maximum | 10.9% | 28.6% |
| Range | 10.1% | 26.6% |
| Mean | 4.4% | 10.6% |
| Median | 4.4% | 9.1% |
| Interquartile 25% (IQ1) | 3.1% | 7.1% |
| Interquartile 75% (IQ3) | 5.4% | 12.7% |
| Interquartile Range (IQR) | 2.3% | 5.6% |
| Standard Deviation (Sample) | 2.2% | 5.6% |
| Standard Deviation (Population) | 2.2% | 5.6% |
Similar Demographics by Professional Degree
Demographics Similar to Immigrants from Eritrea by Professional Degree
In terms of professional degree, the demographic groups most similar to Immigrants from Eritrea are Immigrants from Albania (4.8%, a difference of 0.12%), European (4.8%, a difference of 0.17%), Immigrants from Venezuela (4.8%, a difference of 0.18%), Immigrants from Germany (4.9%, a difference of 0.35%), and Serbian (4.8%, a difference of 0.47%).
| Demographics | Rating | Rank | Professional Degree |
| Immigrants | Syria | 96.0 /100 | #117 | Exceptional 4.9% |
| Croatians | 96.0 /100 | #118 | Exceptional 4.9% |
| Immigrants | Sudan | 95.4 /100 | #119 | Exceptional 4.9% |
| Albanians | 95.3 /100 | #120 | Exceptional 4.9% |
| Immigrants | Moldova | 94.8 /100 | #121 | Exceptional 4.9% |
| Immigrants | Germany | 94.1 /100 | #122 | Exceptional 4.9% |
| Immigrants | Venezuela | 93.8 /100 | #123 | Exceptional 4.8% |
| Immigrants | Eritrea | 93.5 /100 | #124 | Exceptional 4.8% |
| Immigrants | Albania | 93.3 /100 | #125 | Exceptional 4.8% |
| Europeans | 93.2 /100 | #126 | Exceptional 4.8% |
| Serbians | 92.6 /100 | #127 | Exceptional 4.8% |
| Immigrants | Eastern Africa | 92.5 /100 | #128 | Exceptional 4.8% |
| Palestinians | 91.5 /100 | #129 | Exceptional 4.8% |
| Icelanders | 91.5 /100 | #130 | Exceptional 4.8% |
| Immigrants | Nepal | 91.4 /100 | #131 | Exceptional 4.8% |
Demographics Similar to Immigrants from Iran by Professional Degree
In terms of professional degree, the demographic groups most similar to Immigrants from Iran are Okinawan (7.3%, a difference of 0.11%), Filipino (7.6%, a difference of 3.2%), Eastern European (7.1%, a difference of 3.3%), Immigrants from Switzerland (7.1%, a difference of 3.4%), and Immigrants from Taiwan (7.1%, a difference of 3.6%).
| Demographics | Rating | Rank | Professional Degree |
| Immigrants | Israel | 100.0 /100 | #1 | Exceptional 7.9% |
| Immigrants | Singapore | 100.0 /100 | #2 | Exceptional 7.7% |
| Iranians | 100.0 /100 | #3 | Exceptional 7.6% |
| Filipinos | 100.0 /100 | #4 | Exceptional 7.6% |
| Immigrants | Iran | 100.0 /100 | #5 | Exceptional 7.3% |
| Okinawans | 100.0 /100 | #6 | Exceptional 7.3% |
| Eastern Europeans | 100.0 /100 | #7 | Exceptional 7.1% |
| Immigrants | Switzerland | 100.0 /100 | #8 | Exceptional 7.1% |
| Immigrants | Taiwan | 100.0 /100 | #9 | Exceptional 7.1% |
| Immigrants | Belgium | 100.0 /100 | #10 | Exceptional 7.0% |
| Cypriots | 100.0 /100 | #11 | Exceptional 6.9% |
| Israelis | 100.0 /100 | #12 | Exceptional 6.9% |
| Immigrants | Australia | 100.0 /100 | #13 | Exceptional 6.9% |
| Immigrants | France | 100.0 /100 | #14 | Exceptional 6.8% |
| Immigrants | China | 100.0 /100 | #15 | Exceptional 6.7% |