French Canadian vs Immigrants from Cameroon Professional Degree
COMPARE
French Canadian
Immigrants from Cameroon
Professional Degree
Professional Degree Comparison
French Canadians
Immigrants from Cameroon
4.0%
PROFESSIONAL DEGREE
8.0/ 100
METRIC RATING
221st/ 347
METRIC RANK
4.3%
PROFESSIONAL DEGREE
33.3/ 100
METRIC RATING
187th/ 347
METRIC RANK
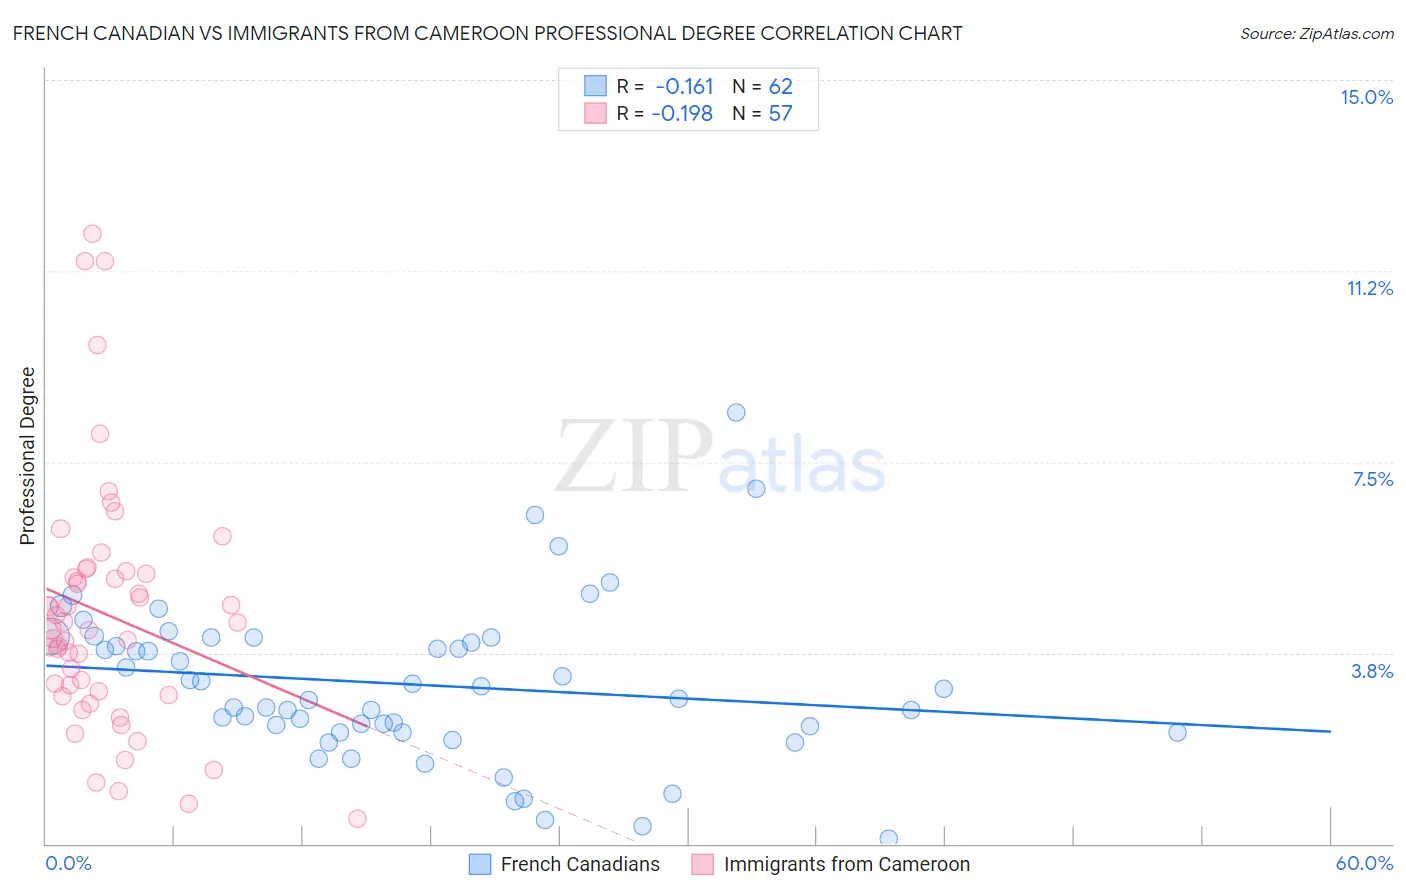
French Canadian vs Immigrants from Cameroon Professional Degree Correlation Chart
The statistical analysis conducted on geographies consisting of 499,387,029 people shows a poor negative correlation between the proportion of French Canadians and percentage of population with at least professional degree education in the United States with a correlation coefficient (R) of -0.161 and weighted average of 4.0%. Similarly, the statistical analysis conducted on geographies consisting of 130,670,643 people shows a poor negative correlation between the proportion of Immigrants from Cameroon and percentage of population with at least professional degree education in the United States with a correlation coefficient (R) of -0.198 and weighted average of 4.3%, a difference of 7.0%.
Professional Degree Correlation Summary
| Measurement | French Canadian | Immigrants from Cameroon |
| Minimum | 0.11% | 0.49% |
| Maximum | 8.5% | 12.0% |
| Range | 8.4% | 11.5% |
| Mean | 3.1% | 4.5% |
| Median | 3.0% | 4.2% |
| Interquartile 25% (IQ1) | 2.2% | 3.0% |
| Interquartile 75% (IQ3) | 4.0% | 5.3% |
| Interquartile Range (IQR) | 1.8% | 2.4% |
| Standard Deviation (Sample) | 1.6% | 2.4% |
| Standard Deviation (Population) | 1.5% | 2.4% |
Similar Demographics by Professional Degree
Demographics Similar to French Canadians by Professional Degree
In terms of professional degree, the demographic groups most similar to French Canadians are Ute (4.0%, a difference of 0.13%), Immigrants from Western Africa (4.0%, a difference of 0.25%), Immigrants from Bosnia and Herzegovina (4.0%, a difference of 0.33%), Trinidadian and Tobagonian (4.0%, a difference of 0.47%), and Immigrants from South Eastern Asia (4.0%, a difference of 0.49%).
| Demographics | Rating | Rank | Professional Degree |
| Immigrants | Ghana | 10.6 /100 | #214 | Poor 4.1% |
| Portuguese | 10.5 /100 | #215 | Poor 4.1% |
| West Indians | 9.8 /100 | #216 | Tragic 4.1% |
| Immigrants | Vietnam | 9.4 /100 | #217 | Tragic 4.0% |
| Dutch | 9.0 /100 | #218 | Tragic 4.0% |
| Immigrants | South Eastern Asia | 8.9 /100 | #219 | Tragic 4.0% |
| Ute | 8.2 /100 | #220 | Tragic 4.0% |
| French Canadians | 8.0 /100 | #221 | Tragic 4.0% |
| Immigrants | Western Africa | 7.5 /100 | #222 | Tragic 4.0% |
| Immigrants | Bosnia and Herzegovina | 7.4 /100 | #223 | Tragic 4.0% |
| Trinidadians and Tobagonians | 7.1 /100 | #224 | Tragic 4.0% |
| Tlingit-Haida | 6.9 /100 | #225 | Tragic 4.0% |
| German Russians | 6.1 /100 | #226 | Tragic 4.0% |
| Cubans | 5.9 /100 | #227 | Tragic 4.0% |
| Immigrants | West Indies | 5.6 /100 | #228 | Tragic 4.0% |
Demographics Similar to Immigrants from Cameroon by Professional Degree
In terms of professional degree, the demographic groups most similar to Immigrants from Cameroon are Scotch-Irish (4.3%, a difference of 0.15%), Immigrants from Thailand (4.3%, a difference of 0.28%), Welsh (4.3%, a difference of 0.42%), Slovak (4.3%, a difference of 0.45%), and Belgian (4.3%, a difference of 0.47%).
| Demographics | Rating | Rank | Professional Degree |
| Czechs | 44.9 /100 | #180 | Average 4.4% |
| Danes | 43.5 /100 | #181 | Average 4.4% |
| Immigrants | Immigrants | 43.2 /100 | #182 | Average 4.4% |
| Bermudans | 43.1 /100 | #183 | Average 4.4% |
| Belgians | 36.2 /100 | #184 | Fair 4.3% |
| Welsh | 35.8 /100 | #185 | Fair 4.3% |
| Scotch-Irish | 34.2 /100 | #186 | Fair 4.3% |
| Immigrants | Cameroon | 33.3 /100 | #187 | Fair 4.3% |
| Immigrants | Thailand | 31.7 /100 | #188 | Fair 4.3% |
| Slovaks | 30.7 /100 | #189 | Fair 4.3% |
| Immigrants | Poland | 29.2 /100 | #190 | Fair 4.3% |
| Sri Lankans | 29.0 /100 | #191 | Fair 4.3% |
| Ghanaians | 27.3 /100 | #192 | Fair 4.3% |
| French | 27.1 /100 | #193 | Fair 4.2% |
| Scandinavians | 25.8 /100 | #194 | Fair 4.2% |