Alaskan Athabascan vs Immigrants from Cameroon Receiving Food Stamps
COMPARE
Alaskan Athabascan
Immigrants from Cameroon
Receiving Food Stamps
Receiving Food Stamps Comparison
Alaskan Athabascans
Immigrants from Cameroon
14.7%
RECEIVING FOOD STAMPS
0.1/ 100
METRIC RATING
273rd/ 347
METRIC RANK
12.0%
RECEIVING FOOD STAMPS
32.5/ 100
METRIC RATING
189th/ 347
METRIC RANK
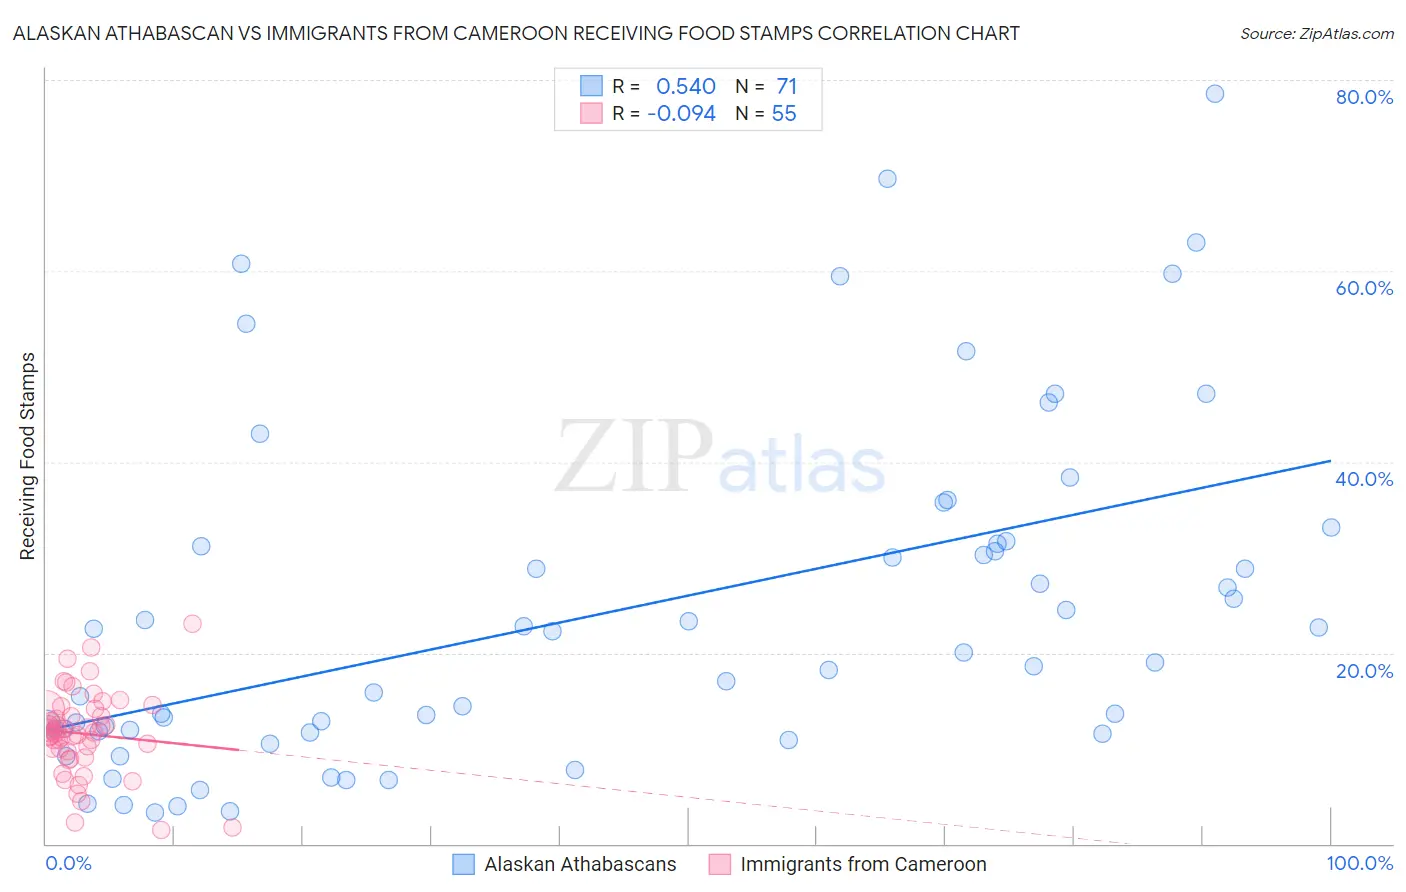
Alaskan Athabascan vs Immigrants from Cameroon Receiving Food Stamps Correlation Chart
The statistical analysis conducted on geographies consisting of 45,801,504 people shows a substantial positive correlation between the proportion of Alaskan Athabascans and percentage of population receiving government assistance and/or food stamps in the United States with a correlation coefficient (R) of 0.540 and weighted average of 14.7%. Similarly, the statistical analysis conducted on geographies consisting of 130,693,457 people shows a slight negative correlation between the proportion of Immigrants from Cameroon and percentage of population receiving government assistance and/or food stamps in the United States with a correlation coefficient (R) of -0.094 and weighted average of 12.0%, a difference of 22.0%.
Receiving Food Stamps Correlation Summary
| Measurement | Alaskan Athabascan | Immigrants from Cameroon |
| Minimum | 3.3% | 1.4% |
| Maximum | 78.5% | 23.1% |
| Range | 75.2% | 21.7% |
| Mean | 24.2% | 11.5% |
| Median | 19.0% | 11.7% |
| Interquartile 25% (IQ1) | 11.8% | 9.6% |
| Interquartile 75% (IQ3) | 31.4% | 14.2% |
| Interquartile Range (IQR) | 19.6% | 4.6% |
| Standard Deviation (Sample) | 17.7% | 4.3% |
| Standard Deviation (Population) | 17.5% | 4.3% |
Similar Demographics by Receiving Food Stamps
Demographics Similar to Alaskan Athabascans by Receiving Food Stamps
In terms of receiving food stamps, the demographic groups most similar to Alaskan Athabascans are Immigrants from Western Africa (14.7%, a difference of 0.020%), Chippewa (14.7%, a difference of 0.030%), Ute (14.7%, a difference of 0.10%), Immigrants from Guatemala (14.6%, a difference of 0.25%), and Mexican (14.6%, a difference of 0.35%).
| Demographics | Rating | Rank | Receiving Food Stamps |
| Cheyenne | 0.2 /100 | #266 | Tragic 14.3% |
| Dutch West Indians | 0.2 /100 | #267 | Tragic 14.3% |
| Guatemalans | 0.1 /100 | #268 | Tragic 14.4% |
| Nepalese | 0.1 /100 | #269 | Tragic 14.6% |
| Mexicans | 0.1 /100 | #270 | Tragic 14.6% |
| Immigrants | Guatemala | 0.1 /100 | #271 | Tragic 14.6% |
| Chippewa | 0.1 /100 | #272 | Tragic 14.7% |
| Alaskan Athabascans | 0.1 /100 | #273 | Tragic 14.7% |
| Immigrants | Western Africa | 0.1 /100 | #274 | Tragic 14.7% |
| Ute | 0.1 /100 | #275 | Tragic 14.7% |
| Liberians | 0.1 /100 | #276 | Tragic 14.8% |
| Seminole | 0.1 /100 | #277 | Tragic 14.8% |
| Belizeans | 0.1 /100 | #278 | Tragic 14.8% |
| Kiowa | 0.0 /100 | #279 | Tragic 14.9% |
| Ecuadorians | 0.0 /100 | #280 | Tragic 14.9% |
Demographics Similar to Immigrants from Cameroon by Receiving Food Stamps
In terms of receiving food stamps, the demographic groups most similar to Immigrants from Cameroon are Immigrants from Peru (12.0%, a difference of 0.060%), Venezuelan (12.0%, a difference of 0.060%), Sudanese (12.0%, a difference of 0.14%), Samoan (12.1%, a difference of 0.24%), and Albanian (12.0%, a difference of 0.44%).
| Demographics | Rating | Rank | Receiving Food Stamps |
| Immigrants | Morocco | 40.7 /100 | #182 | Average 11.9% |
| Immigrants | Uganda | 40.3 /100 | #183 | Average 11.9% |
| Spaniards | 39.8 /100 | #184 | Fair 11.9% |
| Immigrants | Iraq | 37.1 /100 | #185 | Fair 12.0% |
| Spanish | 36.9 /100 | #186 | Fair 12.0% |
| Albanians | 35.4 /100 | #187 | Fair 12.0% |
| Sudanese | 33.4 /100 | #188 | Fair 12.0% |
| Immigrants | Cameroon | 32.5 /100 | #189 | Fair 12.0% |
| Immigrants | Peru | 32.2 /100 | #190 | Fair 12.0% |
| Venezuelans | 32.1 /100 | #191 | Fair 12.0% |
| Samoans | 31.0 /100 | #192 | Fair 12.1% |
| Immigrants | Fiji | 27.8 /100 | #193 | Fair 12.1% |
| Immigrants | Sudan | 27.1 /100 | #194 | Fair 12.1% |
| Americans | 26.7 /100 | #195 | Fair 12.2% |
| Iraqis | 26.6 /100 | #196 | Fair 12.2% |