Immigrants from Eastern Asia vs Immigrants from Cameroon Professional Degree
COMPARE
Immigrants from Eastern Asia
Immigrants from Cameroon
Professional Degree
Professional Degree Comparison
Immigrants from Eastern Asia
Immigrants from Cameroon
6.6%
PROFESSIONAL DEGREE
100.0/ 100
METRIC RATING
17th/ 347
METRIC RANK
4.3%
PROFESSIONAL DEGREE
33.3/ 100
METRIC RATING
187th/ 347
METRIC RANK
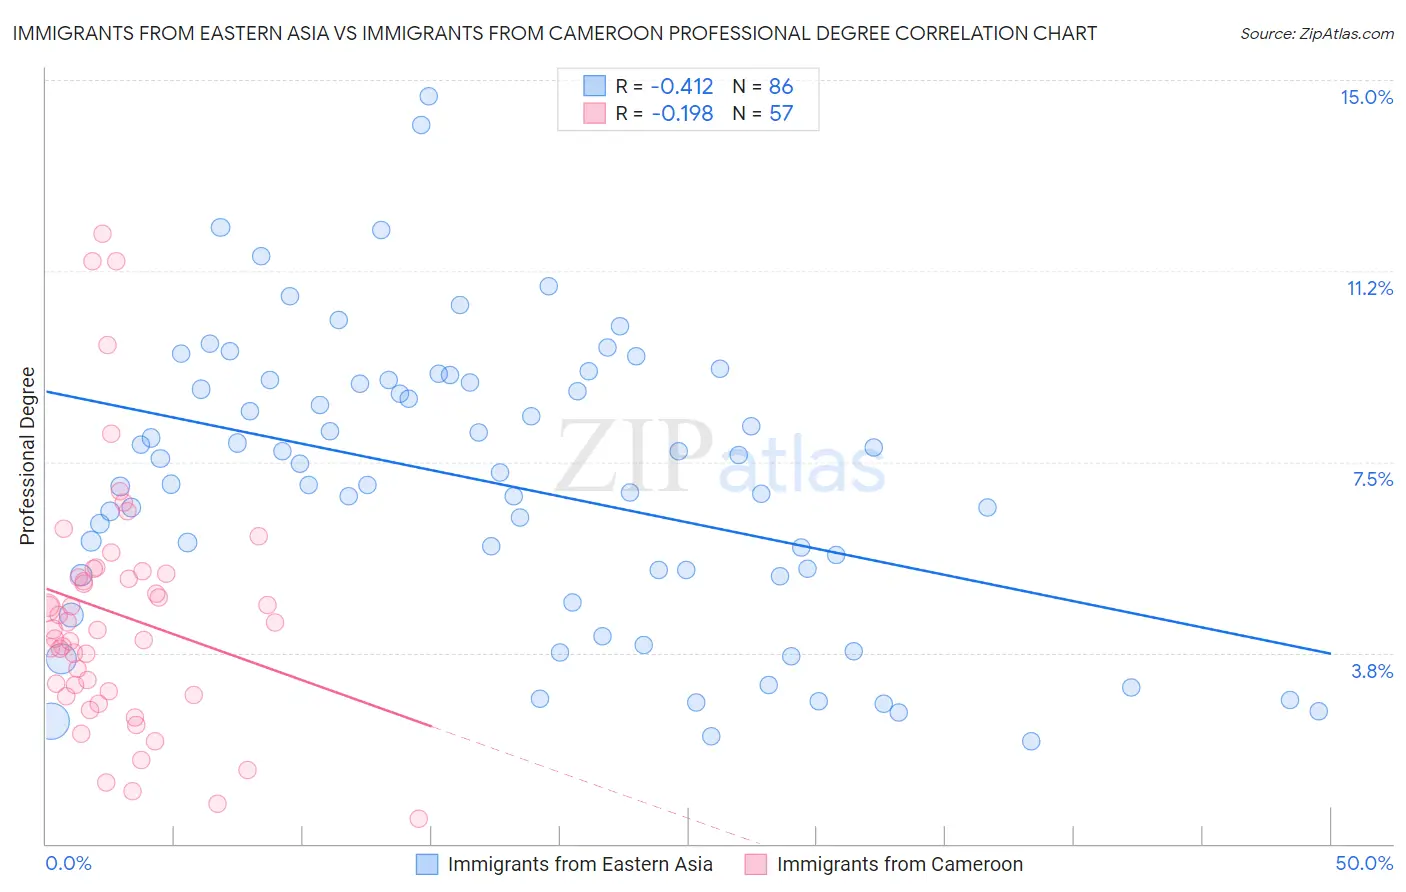
Immigrants from Eastern Asia vs Immigrants from Cameroon Professional Degree Correlation Chart
The statistical analysis conducted on geographies consisting of 498,075,590 people shows a moderate negative correlation between the proportion of Immigrants from Eastern Asia and percentage of population with at least professional degree education in the United States with a correlation coefficient (R) of -0.412 and weighted average of 6.6%. Similarly, the statistical analysis conducted on geographies consisting of 130,670,643 people shows a poor negative correlation between the proportion of Immigrants from Cameroon and percentage of population with at least professional degree education in the United States with a correlation coefficient (R) of -0.198 and weighted average of 4.3%, a difference of 52.9%.
Professional Degree Correlation Summary
| Measurement | Immigrants from Eastern Asia | Immigrants from Cameroon |
| Minimum | 2.0% | 0.49% |
| Maximum | 14.7% | 12.0% |
| Range | 12.7% | 11.5% |
| Mean | 7.1% | 4.5% |
| Median | 7.2% | 4.2% |
| Interquartile 25% (IQ1) | 5.3% | 3.0% |
| Interquartile 75% (IQ3) | 9.1% | 5.3% |
| Interquartile Range (IQR) | 3.8% | 2.4% |
| Standard Deviation (Sample) | 2.8% | 2.4% |
| Standard Deviation (Population) | 2.8% | 2.4% |
Similar Demographics by Professional Degree
Demographics Similar to Immigrants from Eastern Asia by Professional Degree
In terms of professional degree, the demographic groups most similar to Immigrants from Eastern Asia are Soviet Union (6.6%, a difference of 0.020%), Indian (Asian) (6.5%, a difference of 0.68%), Immigrants from Sweden (6.7%, a difference of 2.0%), Immigrants from Denmark (6.4%, a difference of 2.2%), and Immigrants from Hong Kong (6.4%, a difference of 2.5%).
| Demographics | Rating | Rank | Professional Degree |
| Immigrants | Belgium | 100.0 /100 | #10 | Exceptional 7.0% |
| Cypriots | 100.0 /100 | #11 | Exceptional 6.9% |
| Israelis | 100.0 /100 | #12 | Exceptional 6.9% |
| Immigrants | Australia | 100.0 /100 | #13 | Exceptional 6.9% |
| Immigrants | France | 100.0 /100 | #14 | Exceptional 6.8% |
| Immigrants | China | 100.0 /100 | #15 | Exceptional 6.7% |
| Immigrants | Sweden | 100.0 /100 | #16 | Exceptional 6.7% |
| Immigrants | Eastern Asia | 100.0 /100 | #17 | Exceptional 6.6% |
| Soviet Union | 100.0 /100 | #18 | Exceptional 6.6% |
| Indians (Asian) | 100.0 /100 | #19 | Exceptional 6.5% |
| Immigrants | Denmark | 100.0 /100 | #20 | Exceptional 6.4% |
| Immigrants | Hong Kong | 100.0 /100 | #21 | Exceptional 6.4% |
| Immigrants | Japan | 100.0 /100 | #22 | Exceptional 6.4% |
| Russians | 100.0 /100 | #23 | Exceptional 6.3% |
| Immigrants | Spain | 100.0 /100 | #24 | Exceptional 6.3% |
Demographics Similar to Immigrants from Cameroon by Professional Degree
In terms of professional degree, the demographic groups most similar to Immigrants from Cameroon are Scotch-Irish (4.3%, a difference of 0.15%), Immigrants from Thailand (4.3%, a difference of 0.28%), Welsh (4.3%, a difference of 0.42%), Slovak (4.3%, a difference of 0.45%), and Belgian (4.3%, a difference of 0.47%).
| Demographics | Rating | Rank | Professional Degree |
| Czechs | 44.9 /100 | #180 | Average 4.4% |
| Danes | 43.5 /100 | #181 | Average 4.4% |
| Immigrants | Immigrants | 43.2 /100 | #182 | Average 4.4% |
| Bermudans | 43.1 /100 | #183 | Average 4.4% |
| Belgians | 36.2 /100 | #184 | Fair 4.3% |
| Welsh | 35.8 /100 | #185 | Fair 4.3% |
| Scotch-Irish | 34.2 /100 | #186 | Fair 4.3% |
| Immigrants | Cameroon | 33.3 /100 | #187 | Fair 4.3% |
| Immigrants | Thailand | 31.7 /100 | #188 | Fair 4.3% |
| Slovaks | 30.7 /100 | #189 | Fair 4.3% |
| Immigrants | Poland | 29.2 /100 | #190 | Fair 4.3% |
| Sri Lankans | 29.0 /100 | #191 | Fair 4.3% |
| Ghanaians | 27.3 /100 | #192 | Fair 4.3% |
| French | 27.1 /100 | #193 | Fair 4.2% |
| Scandinavians | 25.8 /100 | #194 | Fair 4.2% |