Czech vs Immigrants from Australia Doctorate Degree
COMPARE
Czech
Immigrants from Australia
Doctorate Degree
Doctorate Degree Comparison
Czechs
Immigrants from Australia
1.9%
DOCTORATE DEGREE
67.3/ 100
METRIC RATING
163rd/ 347
METRIC RANK
2.8%
DOCTORATE DEGREE
100.0/ 100
METRIC RATING
17th/ 347
METRIC RANK
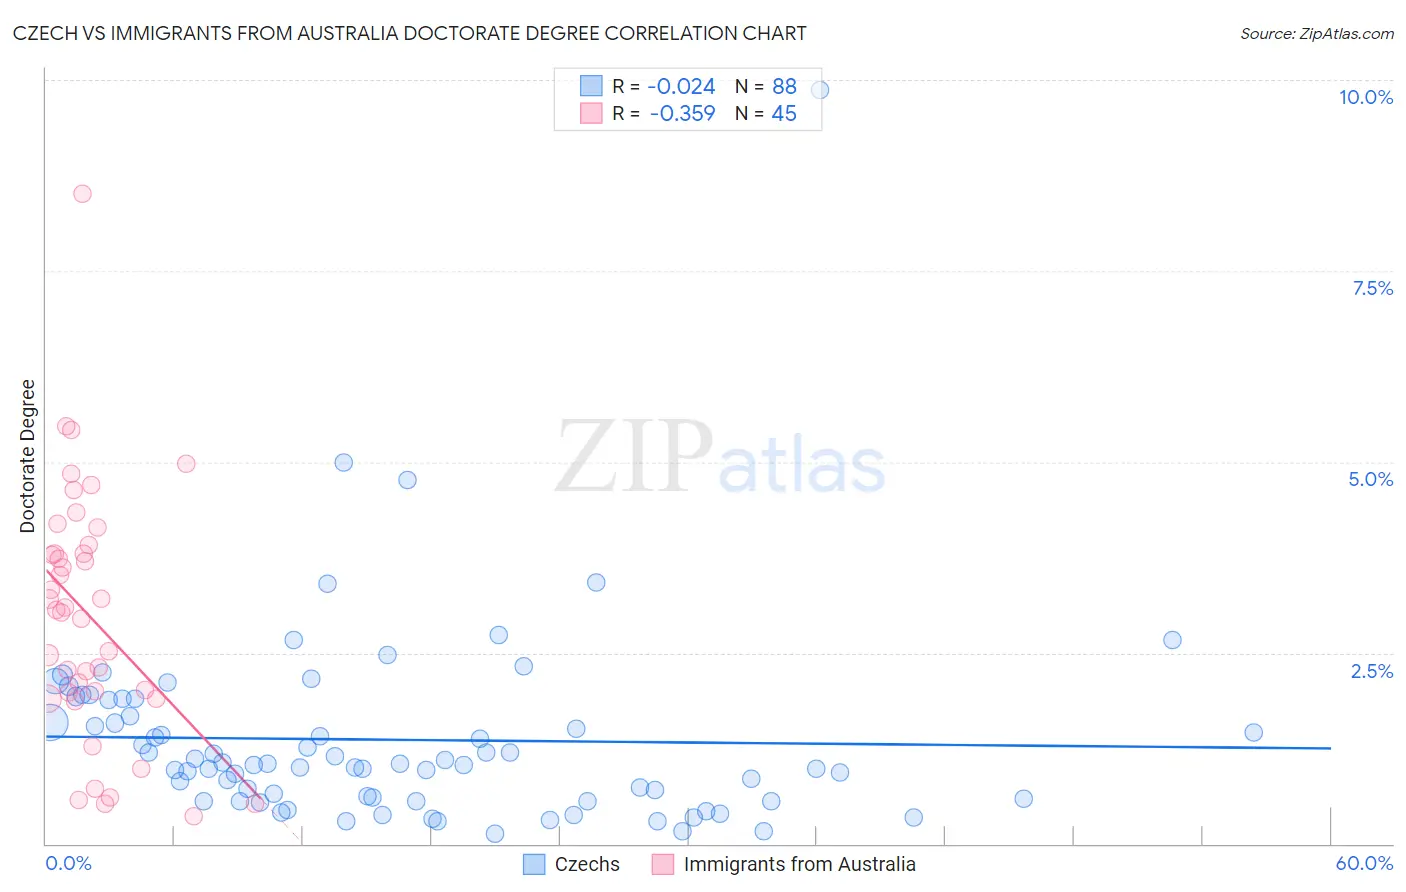
Czech vs Immigrants from Australia Doctorate Degree Correlation Chart
The statistical analysis conducted on geographies consisting of 474,197,515 people shows no correlation between the proportion of Czechs and percentage of population with at least doctorate degree education in the United States with a correlation coefficient (R) of -0.024 and weighted average of 1.9%. Similarly, the statistical analysis conducted on geographies consisting of 226,352,894 people shows a mild negative correlation between the proportion of Immigrants from Australia and percentage of population with at least doctorate degree education in the United States with a correlation coefficient (R) of -0.359 and weighted average of 2.8%, a difference of 48.4%.
Doctorate Degree Correlation Summary
| Measurement | Czech | Immigrants from Australia |
| Minimum | 0.13% | 0.36% |
| Maximum | 9.9% | 8.5% |
| Range | 9.7% | 8.2% |
| Mean | 1.4% | 3.0% |
| Median | 1.0% | 3.1% |
| Interquartile 25% (IQ1) | 0.58% | 1.9% |
| Interquartile 75% (IQ3) | 1.8% | 3.9% |
| Interquartile Range (IQR) | 1.2% | 1.9% |
| Standard Deviation (Sample) | 1.3% | 1.6% |
| Standard Deviation (Population) | 1.3% | 1.6% |
Similar Demographics by Doctorate Degree
Demographics Similar to Czechs by Doctorate Degree
In terms of doctorate degree, the demographic groups most similar to Czechs are Irish (1.9%, a difference of 0.040%), Celtic (1.9%, a difference of 0.10%), Immigrants from Middle Africa (1.9%, a difference of 0.25%), Welsh (1.9%, a difference of 0.40%), and Slovene (1.9%, a difference of 0.49%).
| Demographics | Rating | Rank | Doctorate Degree |
| Slavs | 72.4 /100 | #156 | Good 1.9% |
| Danes | 71.9 /100 | #157 | Good 1.9% |
| Hungarians | 71.7 /100 | #158 | Good 1.9% |
| Slovenes | 70.2 /100 | #159 | Good 1.9% |
| Welsh | 69.7 /100 | #160 | Good 1.9% |
| Immigrants | Middle Africa | 68.8 /100 | #161 | Good 1.9% |
| Irish | 67.5 /100 | #162 | Good 1.9% |
| Czechs | 67.3 /100 | #163 | Good 1.9% |
| Celtics | 66.7 /100 | #164 | Good 1.9% |
| Scotch-Irish | 63.6 /100 | #165 | Good 1.9% |
| Spaniards | 63.5 /100 | #166 | Good 1.9% |
| Macedonians | 60.9 /100 | #167 | Good 1.9% |
| Sri Lankans | 60.3 /100 | #168 | Good 1.9% |
| Vietnamese | 54.8 /100 | #169 | Average 1.9% |
| Costa Ricans | 53.3 /100 | #170 | Average 1.8% |
Demographics Similar to Immigrants from Australia by Doctorate Degree
In terms of doctorate degree, the demographic groups most similar to Immigrants from Australia are Immigrants from Sri Lanka (2.8%, a difference of 0.24%), Immigrants from Japan (2.8%, a difference of 0.62%), Eastern European (2.8%, a difference of 0.70%), Immigrants from Hong Kong (2.8%, a difference of 0.97%), and Immigrants from India (2.8%, a difference of 1.0%).
| Demographics | Rating | Rank | Doctorate Degree |
| Immigrants | Eastern Asia | 100.0 /100 | #10 | Exceptional 3.0% |
| Indians (Asian) | 100.0 /100 | #11 | Exceptional 2.9% |
| Immigrants | Belgium | 100.0 /100 | #12 | Exceptional 2.9% |
| Immigrants | Sweden | 100.0 /100 | #13 | Exceptional 2.9% |
| Immigrants | France | 100.0 /100 | #14 | Exceptional 2.9% |
| Immigrants | India | 100.0 /100 | #15 | Exceptional 2.8% |
| Eastern Europeans | 100.0 /100 | #16 | Exceptional 2.8% |
| Immigrants | Australia | 100.0 /100 | #17 | Exceptional 2.8% |
| Immigrants | Sri Lanka | 100.0 /100 | #18 | Exceptional 2.8% |
| Immigrants | Japan | 100.0 /100 | #19 | Exceptional 2.8% |
| Immigrants | Hong Kong | 100.0 /100 | #20 | Exceptional 2.8% |
| Thais | 100.0 /100 | #21 | Exceptional 2.8% |
| Mongolians | 100.0 /100 | #22 | Exceptional 2.8% |
| Immigrants | Denmark | 100.0 /100 | #23 | Exceptional 2.8% |
| Israelis | 100.0 /100 | #24 | Exceptional 2.7% |