Alaska Native vs Immigrants from Afghanistan 10th Grade
COMPARE
Alaska Native
Immigrants from Afghanistan
10th Grade
10th Grade Comparison
Alaska Natives
Immigrants from Afghanistan
94.9%
10TH GRADE
99.6/ 100
METRIC RATING
71st/ 347
METRIC RANK
92.8%
10TH GRADE
1.4/ 100
METRIC RATING
247th/ 347
METRIC RANK
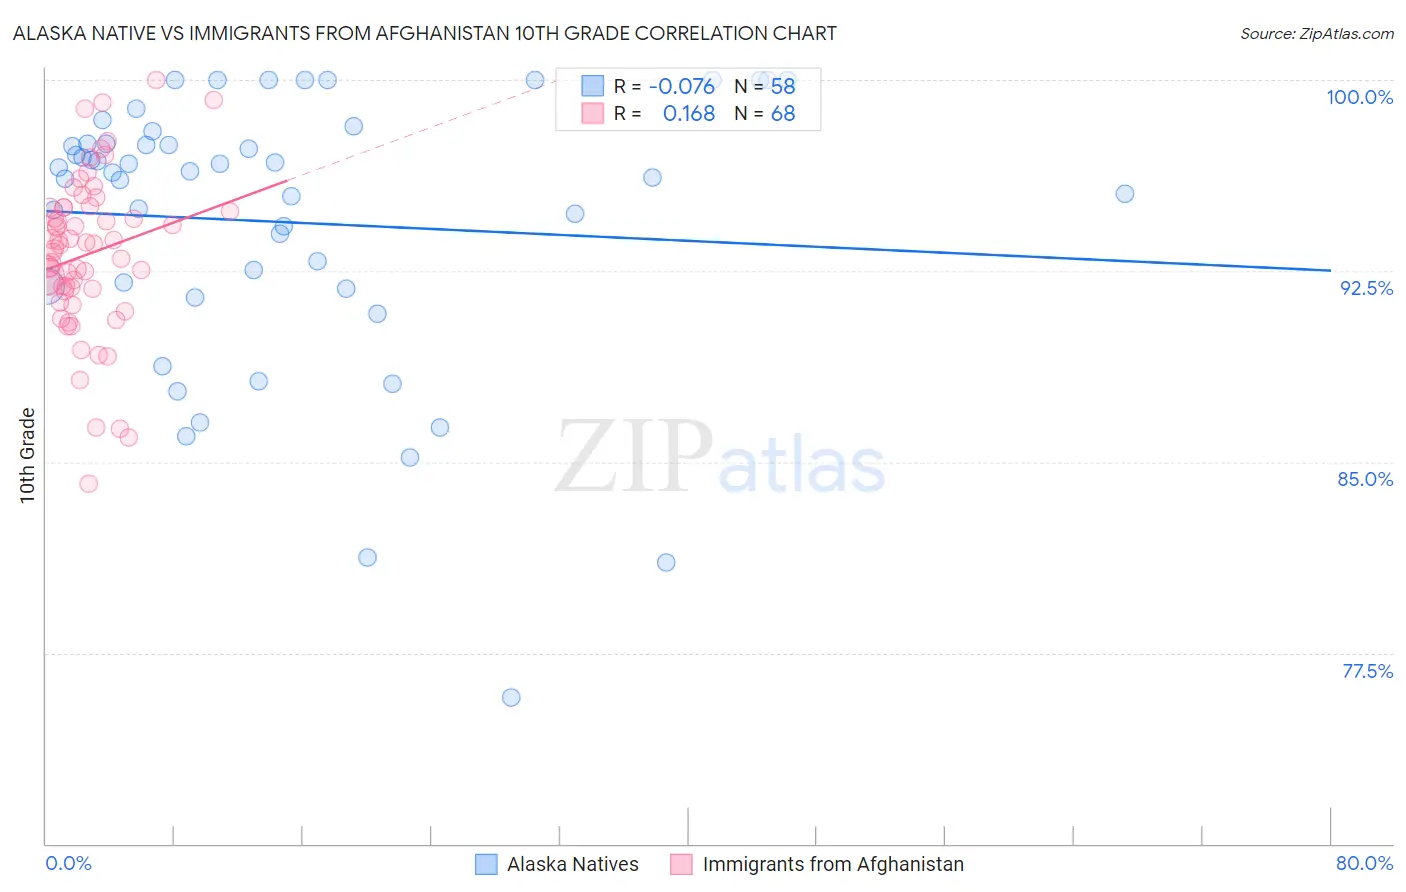
Alaska Native vs Immigrants from Afghanistan 10th Grade Correlation Chart
The statistical analysis conducted on geographies consisting of 76,778,743 people shows a slight negative correlation between the proportion of Alaska Natives and percentage of population with at least 10th grade education in the United States with a correlation coefficient (R) of -0.076 and weighted average of 94.9%. Similarly, the statistical analysis conducted on geographies consisting of 147,629,924 people shows a poor positive correlation between the proportion of Immigrants from Afghanistan and percentage of population with at least 10th grade education in the United States with a correlation coefficient (R) of 0.168 and weighted average of 92.8%, a difference of 2.2%.
10th Grade Correlation Summary
| Measurement | Alaska Native | Immigrants from Afghanistan |
| Minimum | 75.7% | 84.2% |
| Maximum | 100.0% | 100.0% |
| Range | 24.3% | 15.8% |
| Mean | 94.4% | 93.2% |
| Median | 96.4% | 93.4% |
| Interquartile 25% (IQ1) | 91.9% | 91.7% |
| Interquartile 75% (IQ3) | 97.5% | 95.0% |
| Interquartile Range (IQR) | 5.6% | 3.3% |
| Standard Deviation (Sample) | 5.4% | 3.1% |
| Standard Deviation (Population) | 5.4% | 3.1% |
Similar Demographics by 10th Grade
Demographics Similar to Alaska Natives by 10th Grade
In terms of 10th grade, the demographic groups most similar to Alaska Natives are Zimbabwean (94.9%, a difference of 0.0%), Immigrants from England (94.9%, a difference of 0.010%), Immigrants from Sweden (94.9%, a difference of 0.020%), Bhutanese (94.9%, a difference of 0.020%), and Canadian (94.9%, a difference of 0.020%).
| Demographics | Rating | Rank | 10th Grade |
| Native Hawaiians | 99.7 /100 | #64 | Exceptional 95.0% |
| Turks | 99.7 /100 | #65 | Exceptional 95.0% |
| Immigrants | Australia | 99.7 /100 | #66 | Exceptional 94.9% |
| Immigrants | Netherlands | 99.7 /100 | #67 | Exceptional 94.9% |
| Immigrants | Belgium | 99.7 /100 | #68 | Exceptional 94.9% |
| Immigrants | England | 99.6 /100 | #69 | Exceptional 94.9% |
| Zimbabweans | 99.6 /100 | #70 | Exceptional 94.9% |
| Alaska Natives | 99.6 /100 | #71 | Exceptional 94.9% |
| Immigrants | Sweden | 99.6 /100 | #72 | Exceptional 94.9% |
| Bhutanese | 99.6 /100 | #73 | Exceptional 94.9% |
| Canadians | 99.6 /100 | #74 | Exceptional 94.9% |
| Okinawans | 99.5 /100 | #75 | Exceptional 94.8% |
| Romanians | 99.5 /100 | #76 | Exceptional 94.8% |
| Immigrants | South Africa | 99.5 /100 | #77 | Exceptional 94.8% |
| Filipinos | 99.3 /100 | #78 | Exceptional 94.8% |
Demographics Similar to Immigrants from Afghanistan by 10th Grade
In terms of 10th grade, the demographic groups most similar to Immigrants from Afghanistan are Colombian (92.8%, a difference of 0.010%), Immigrants from Senegal (92.8%, a difference of 0.010%), Immigrants from Middle Africa (92.9%, a difference of 0.040%), Jamaican (92.8%, a difference of 0.040%), and Uruguayan (92.9%, a difference of 0.060%).
| Demographics | Rating | Rank | 10th Grade |
| Immigrants | Hong Kong | 4.2 /100 | #240 | Tragic 93.1% |
| Immigrants | Somalia | 2.7 /100 | #241 | Tragic 93.0% |
| Immigrants | Cameroon | 2.6 /100 | #242 | Tragic 93.0% |
| Senegalese | 2.4 /100 | #243 | Tragic 93.0% |
| Spanish Americans | 2.1 /100 | #244 | Tragic 92.9% |
| Uruguayans | 1.8 /100 | #245 | Tragic 92.9% |
| Immigrants | Middle Africa | 1.7 /100 | #246 | Tragic 92.9% |
| Immigrants | Afghanistan | 1.4 /100 | #247 | Tragic 92.8% |
| Colombians | 1.4 /100 | #248 | Tragic 92.8% |
| Immigrants | Senegal | 1.4 /100 | #249 | Tragic 92.8% |
| Jamaicans | 1.2 /100 | #250 | Tragic 92.8% |
| Immigrants | Thailand | 1.0 /100 | #251 | Tragic 92.8% |
| South Americans | 0.9 /100 | #252 | Tragic 92.8% |
| Ghanaians | 0.9 /100 | #253 | Tragic 92.8% |
| Armenians | 0.9 /100 | #254 | Tragic 92.7% |