Alaska Native vs Creek 10th Grade
COMPARE
Alaska Native
Creek
10th Grade
10th Grade Comparison
Alaska Natives
Creek
94.9%
10TH GRADE
99.6/ 100
METRIC RATING
71st/ 347
METRIC RANK
94.2%
10TH GRADE
91.9/ 100
METRIC RATING
133rd/ 347
METRIC RANK
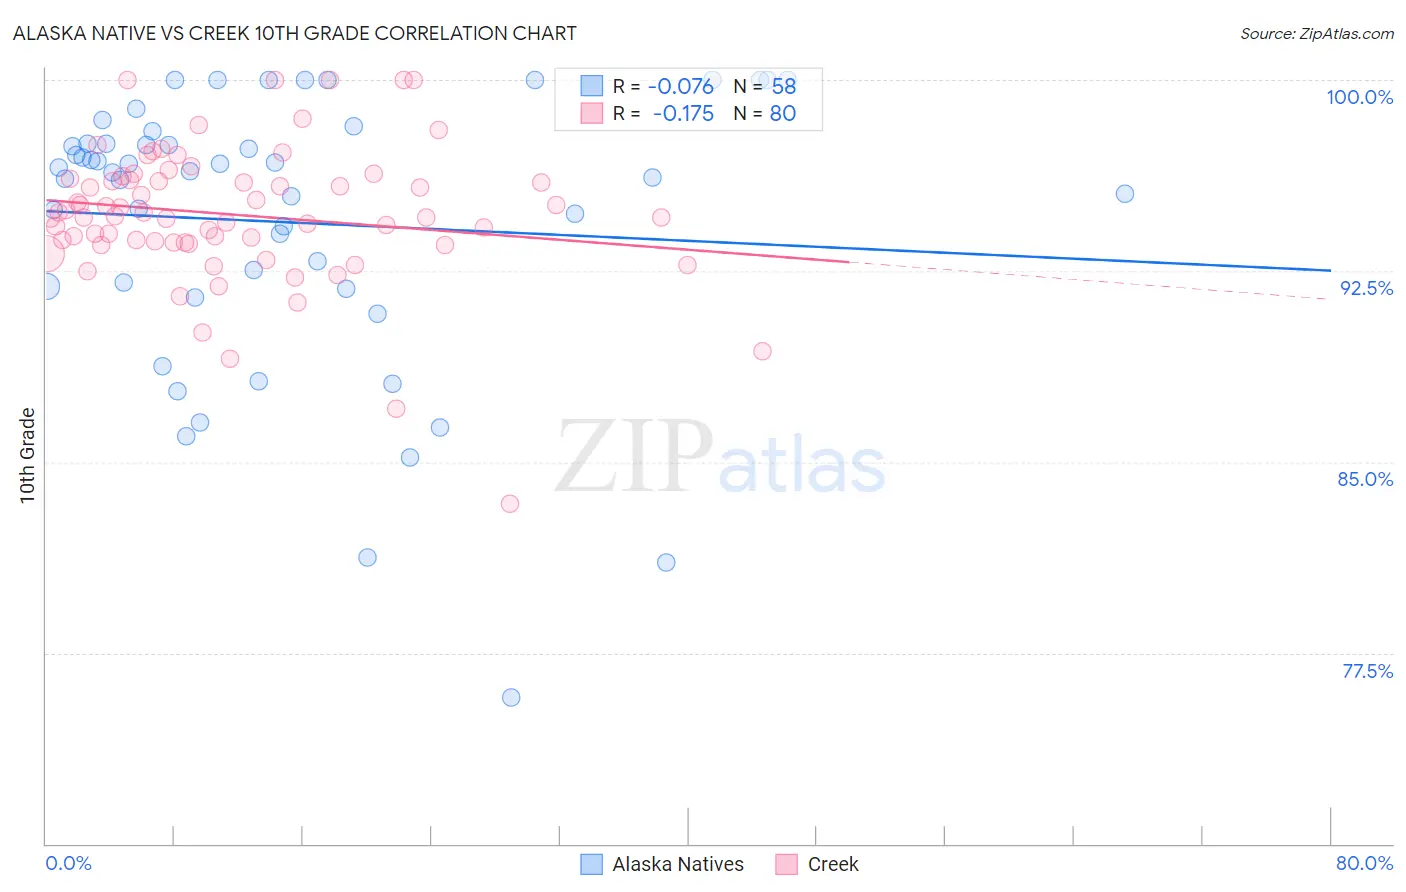
Alaska Native vs Creek 10th Grade Correlation Chart
The statistical analysis conducted on geographies consisting of 76,778,743 people shows a slight negative correlation between the proportion of Alaska Natives and percentage of population with at least 10th grade education in the United States with a correlation coefficient (R) of -0.076 and weighted average of 94.9%. Similarly, the statistical analysis conducted on geographies consisting of 178,480,629 people shows a poor negative correlation between the proportion of Creek and percentage of population with at least 10th grade education in the United States with a correlation coefficient (R) of -0.175 and weighted average of 94.2%, a difference of 0.69%.
10th Grade Correlation Summary
| Measurement | Alaska Native | Creek |
| Minimum | 75.7% | 83.3% |
| Maximum | 100.0% | 100.0% |
| Range | 24.3% | 16.7% |
| Mean | 94.4% | 94.7% |
| Median | 96.4% | 94.6% |
| Interquartile 25% (IQ1) | 91.9% | 93.6% |
| Interquartile 75% (IQ3) | 97.5% | 96.1% |
| Interquartile Range (IQR) | 5.6% | 2.5% |
| Standard Deviation (Sample) | 5.4% | 2.7% |
| Standard Deviation (Population) | 5.4% | 2.7% |
Similar Demographics by 10th Grade
Demographics Similar to Alaska Natives by 10th Grade
In terms of 10th grade, the demographic groups most similar to Alaska Natives are Zimbabwean (94.9%, a difference of 0.0%), Immigrants from England (94.9%, a difference of 0.010%), Immigrants from Sweden (94.9%, a difference of 0.020%), Bhutanese (94.9%, a difference of 0.020%), and Canadian (94.9%, a difference of 0.020%).
| Demographics | Rating | Rank | 10th Grade |
| Native Hawaiians | 99.7 /100 | #64 | Exceptional 95.0% |
| Turks | 99.7 /100 | #65 | Exceptional 95.0% |
| Immigrants | Australia | 99.7 /100 | #66 | Exceptional 94.9% |
| Immigrants | Netherlands | 99.7 /100 | #67 | Exceptional 94.9% |
| Immigrants | Belgium | 99.7 /100 | #68 | Exceptional 94.9% |
| Immigrants | England | 99.6 /100 | #69 | Exceptional 94.9% |
| Zimbabweans | 99.6 /100 | #70 | Exceptional 94.9% |
| Alaska Natives | 99.6 /100 | #71 | Exceptional 94.9% |
| Immigrants | Sweden | 99.6 /100 | #72 | Exceptional 94.9% |
| Bhutanese | 99.6 /100 | #73 | Exceptional 94.9% |
| Canadians | 99.6 /100 | #74 | Exceptional 94.9% |
| Okinawans | 99.5 /100 | #75 | Exceptional 94.8% |
| Romanians | 99.5 /100 | #76 | Exceptional 94.8% |
| Immigrants | South Africa | 99.5 /100 | #77 | Exceptional 94.8% |
| Filipinos | 99.3 /100 | #78 | Exceptional 94.8% |
Demographics Similar to Creek by 10th Grade
In terms of 10th grade, the demographic groups most similar to Creek are Immigrants from Russia (94.3%, a difference of 0.010%), Osage (94.2%, a difference of 0.010%), Immigrants from Eastern Europe (94.3%, a difference of 0.020%), Immigrants from Korea (94.2%, a difference of 0.020%), and Iroquois (94.3%, a difference of 0.030%).
| Demographics | Rating | Rank | 10th Grade |
| Immigrants | Iran | 94.4 /100 | #126 | Exceptional 94.3% |
| Israelis | 93.8 /100 | #127 | Exceptional 94.3% |
| Potawatomi | 93.6 /100 | #128 | Exceptional 94.3% |
| Iroquois | 92.8 /100 | #129 | Exceptional 94.3% |
| Immigrants | Greece | 92.7 /100 | #130 | Exceptional 94.3% |
| Immigrants | Eastern Europe | 92.5 /100 | #131 | Exceptional 94.3% |
| Immigrants | Russia | 92.4 /100 | #132 | Exceptional 94.3% |
| Creek | 91.9 /100 | #133 | Exceptional 94.2% |
| Osage | 91.7 /100 | #134 | Exceptional 94.2% |
| Immigrants | Korea | 91.3 /100 | #135 | Exceptional 94.2% |
| Shoshone | 90.8 /100 | #136 | Exceptional 94.2% |
| Arapaho | 90.5 /100 | #137 | Exceptional 94.2% |
| Immigrants | Sri Lanka | 89.9 /100 | #138 | Excellent 94.2% |
| Immigrants | Bosnia and Herzegovina | 89.4 /100 | #139 | Excellent 94.2% |
| Immigrants | Jordan | 87.6 /100 | #140 | Excellent 94.1% |