African vs Immigrants from Kenya 6th Grade
COMPARE
African
Immigrants from Kenya
6th Grade
6th Grade Comparison
Africans
Immigrants from Kenya
96.9%
6TH GRADE
14.8/ 100
METRIC RATING
200th/ 347
METRIC RANK
97.0%
6TH GRADE
45.3/ 100
METRIC RATING
179th/ 347
METRIC RANK
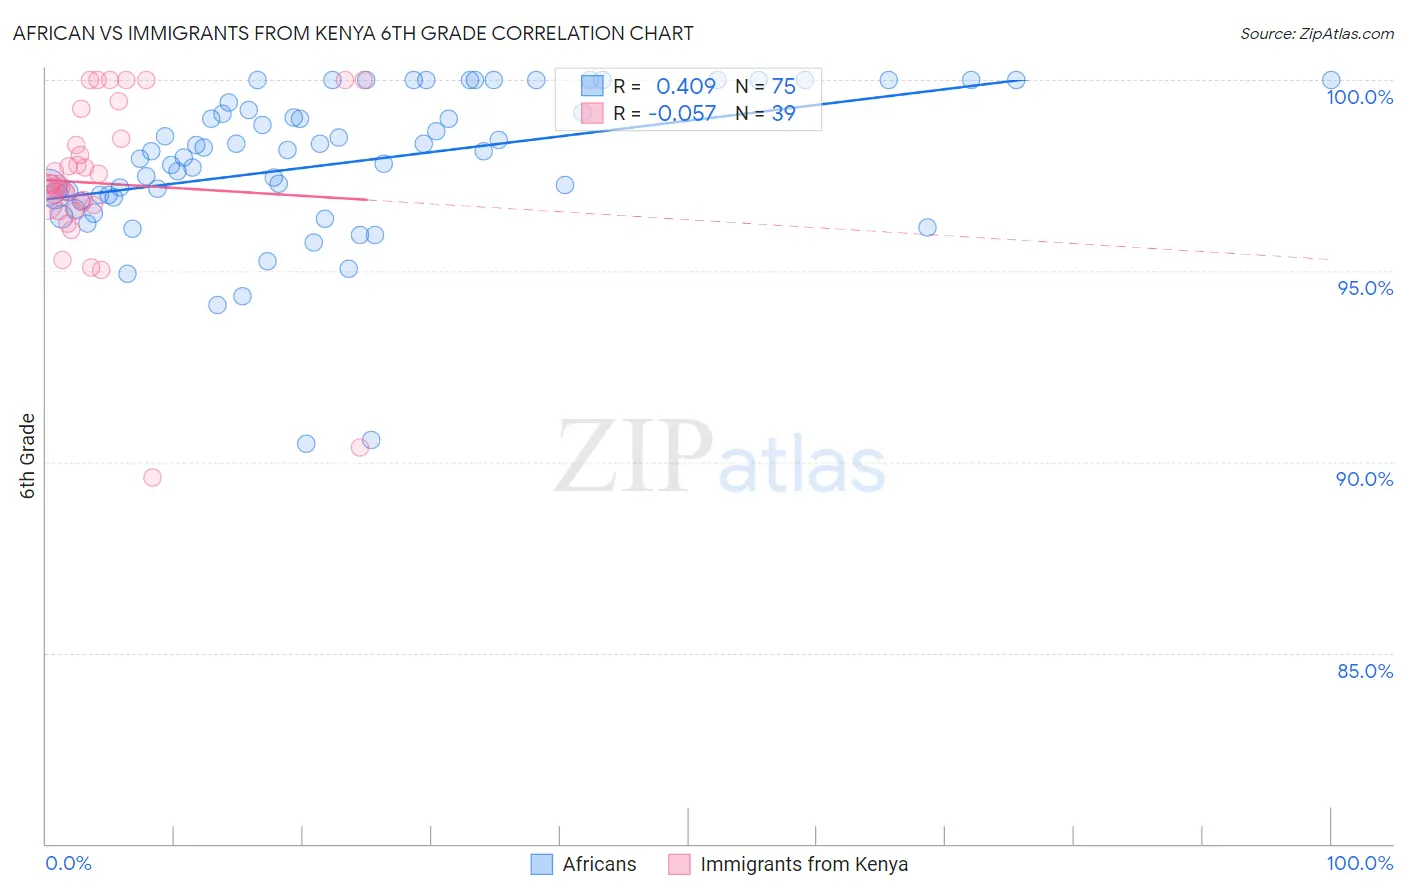
African vs Immigrants from Kenya 6th Grade Correlation Chart
The statistical analysis conducted on geographies consisting of 470,094,744 people shows a moderate positive correlation between the proportion of Africans and percentage of population with at least 6th grade education in the United States with a correlation coefficient (R) of 0.409 and weighted average of 96.9%. Similarly, the statistical analysis conducted on geographies consisting of 218,076,690 people shows a slight negative correlation between the proportion of Immigrants from Kenya and percentage of population with at least 6th grade education in the United States with a correlation coefficient (R) of -0.057 and weighted average of 97.0%, a difference of 0.18%.
6th Grade Correlation Summary
| Measurement | African | Immigrants from Kenya |
| Minimum | 90.5% | 89.6% |
| Maximum | 100.0% | 100.0% |
| Range | 9.5% | 10.4% |
| Mean | 97.8% | 97.3% |
| Median | 98.1% | 97.3% |
| Interquartile 25% (IQ1) | 96.9% | 96.7% |
| Interquartile 75% (IQ3) | 99.4% | 98.5% |
| Interquartile Range (IQR) | 2.5% | 1.7% |
| Standard Deviation (Sample) | 2.0% | 2.2% |
| Standard Deviation (Population) | 2.0% | 2.2% |
Similar Demographics by 6th Grade
Demographics Similar to Africans by 6th Grade
In terms of 6th grade, the demographic groups most similar to Africans are Immigrants from Zaire (96.9%, a difference of 0.0%), Immigrants from Northern Africa (96.9%, a difference of 0.010%), Immigrants from Chile (96.8%, a difference of 0.010%), Sudanese (96.8%, a difference of 0.010%), and Immigrants from Bahamas (96.8%, a difference of 0.010%).
| Demographics | Rating | Rank | 6th Grade |
| Paraguayans | 26.6 /100 | #193 | Fair 96.9% |
| Immigrants | Lebanon | 25.6 /100 | #194 | Fair 96.9% |
| Immigrants | Brazil | 25.5 /100 | #195 | Fair 96.9% |
| Immigrants | Uganda | 21.2 /100 | #196 | Fair 96.9% |
| Brazilians | 20.1 /100 | #197 | Fair 96.9% |
| Immigrants | Albania | 18.8 /100 | #198 | Poor 96.9% |
| Immigrants | Northern Africa | 15.7 /100 | #199 | Poor 96.9% |
| Africans | 14.8 /100 | #200 | Poor 96.9% |
| Immigrants | Zaire | 14.5 /100 | #201 | Poor 96.9% |
| Immigrants | Chile | 14.2 /100 | #202 | Poor 96.8% |
| Sudanese | 13.9 /100 | #203 | Poor 96.8% |
| Immigrants | Bahamas | 13.8 /100 | #204 | Poor 96.8% |
| Natives/Alaskans | 13.0 /100 | #205 | Poor 96.8% |
| Laotians | 11.8 /100 | #206 | Poor 96.8% |
| Iraqis | 11.7 /100 | #207 | Poor 96.8% |
Demographics Similar to Immigrants from Kenya by 6th Grade
In terms of 6th grade, the demographic groups most similar to Immigrants from Kenya are Pakistani (97.0%, a difference of 0.0%), Immigrants from Kazakhstan (97.0%, a difference of 0.010%), Immigrants from Micronesia (97.0%, a difference of 0.010%), Mongolian (97.0%, a difference of 0.010%), and Arab (97.0%, a difference of 0.020%).
| Demographics | Rating | Rank | 6th Grade |
| Egyptians | 50.9 /100 | #172 | Average 97.1% |
| Arabs | 50.1 /100 | #173 | Average 97.0% |
| Venezuelans | 50.0 /100 | #174 | Average 97.0% |
| Immigrants | Kazakhstan | 47.3 /100 | #175 | Average 97.0% |
| Immigrants | Micronesia | 47.1 /100 | #176 | Average 97.0% |
| Mongolians | 46.7 /100 | #177 | Average 97.0% |
| Pakistanis | 46.0 /100 | #178 | Average 97.0% |
| Immigrants | Kenya | 45.3 /100 | #179 | Average 97.0% |
| Immigrants | Spain | 39.9 /100 | #180 | Fair 97.0% |
| Comanche | 37.9 /100 | #181 | Fair 97.0% |
| Immigrants | Ukraine | 35.6 /100 | #182 | Fair 97.0% |
| Immigrants | Venezuela | 34.5 /100 | #183 | Fair 97.0% |
| Spanish Americans | 33.5 /100 | #184 | Fair 97.0% |
| Argentineans | 33.0 /100 | #185 | Fair 97.0% |
| Immigrants | Egypt | 31.4 /100 | #186 | Fair 97.0% |