African vs Hmong Kindergarten
COMPARE
African
Hmong
Kindergarten
Kindergarten Comparison
Africans
Hmong
97.8%
KINDERGARTEN
16.1/ 100
METRIC RATING
207th/ 347
METRIC RANK
98.1%
KINDERGARTEN
78.8/ 100
METRIC RATING
145th/ 347
METRIC RANK
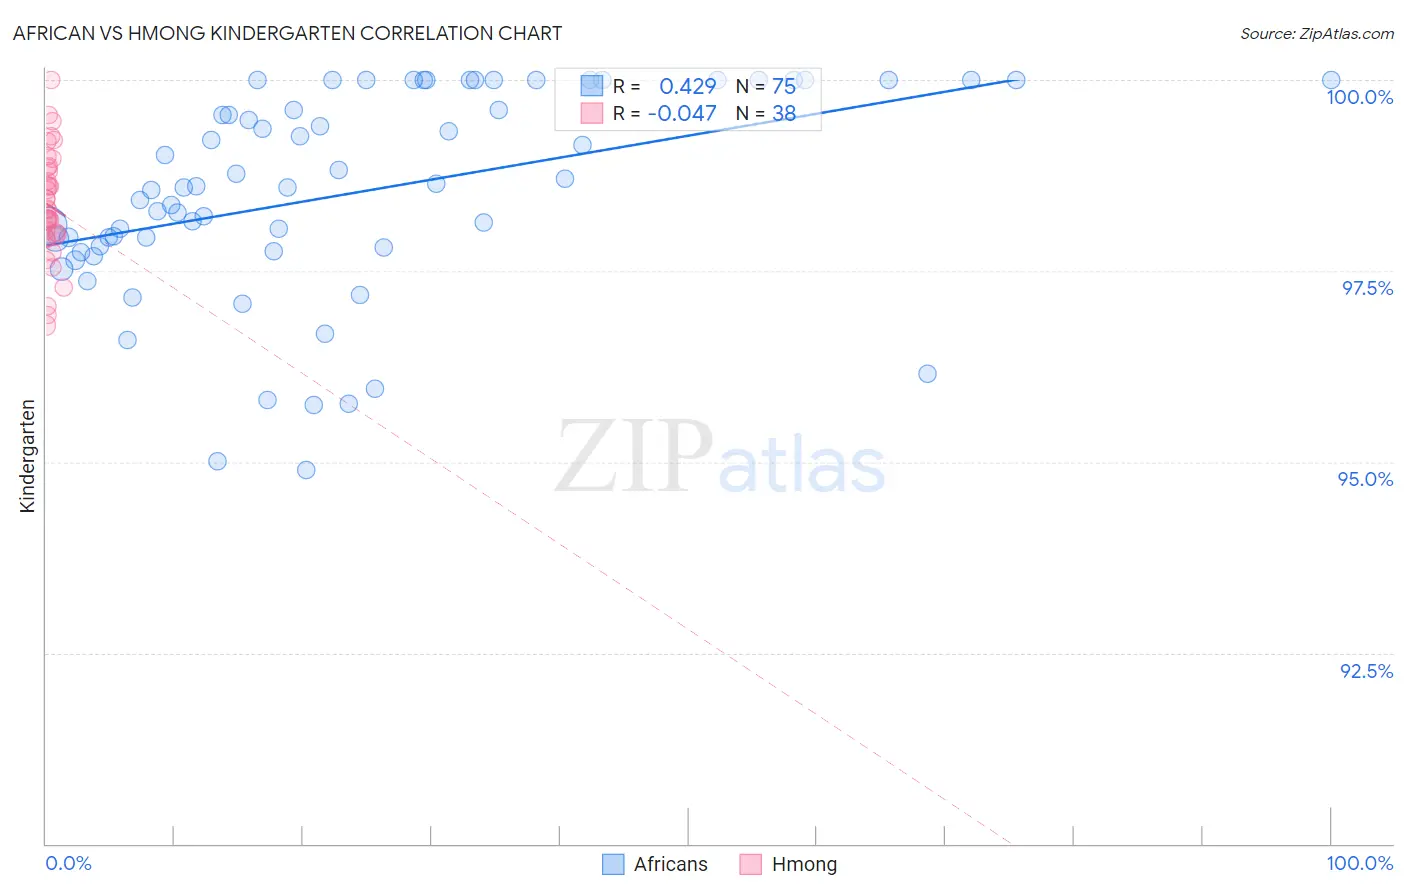
African vs Hmong Kindergarten Correlation Chart
The statistical analysis conducted on geographies consisting of 470,094,148 people shows a moderate positive correlation between the proportion of Africans and percentage of population with at least kindergarten education in the United States with a correlation coefficient (R) of 0.429 and weighted average of 97.8%. Similarly, the statistical analysis conducted on geographies consisting of 24,672,093 people shows no correlation between the proportion of Hmong and percentage of population with at least kindergarten education in the United States with a correlation coefficient (R) of -0.047 and weighted average of 98.1%, a difference of 0.23%.
Kindergarten Correlation Summary
| Measurement | African | Hmong |
| Minimum | 94.9% | 96.8% |
| Maximum | 100.0% | 100.0% |
| Range | 5.1% | 3.2% |
| Mean | 98.5% | 98.4% |
| Median | 98.6% | 98.3% |
| Interquartile 25% (IQ1) | 97.8% | 98.0% |
| Interquartile 75% (IQ3) | 100.0% | 98.9% |
| Interquartile Range (IQR) | 2.2% | 0.90% |
| Standard Deviation (Sample) | 1.4% | 0.73% |
| Standard Deviation (Population) | 1.3% | 0.72% |
Similar Demographics by Kindergarten
Demographics Similar to Africans by Kindergarten
In terms of kindergarten, the demographic groups most similar to Africans are Immigrants from Albania (97.8%, a difference of 0.0%), Immigrants from Uganda (97.8%, a difference of 0.010%), Immigrants from Chile (97.8%, a difference of 0.010%), Immigrants from Southern Europe (97.8%, a difference of 0.010%), and Immigrants from Lebanon (97.9%, a difference of 0.020%).
| Demographics | Rating | Rank | Kindergarten |
| Yuman | 21.6 /100 | #200 | Fair 97.9% |
| Immigrants | Lebanon | 20.9 /100 | #201 | Fair 97.9% |
| Immigrants | Ukraine | 19.1 /100 | #202 | Poor 97.8% |
| Immigrants | Uganda | 18.8 /100 | #203 | Poor 97.8% |
| Immigrants | Chile | 18.1 /100 | #204 | Poor 97.8% |
| Immigrants | Southern Europe | 18.0 /100 | #205 | Poor 97.8% |
| Immigrants | Albania | 16.4 /100 | #206 | Poor 97.8% |
| Africans | 16.1 /100 | #207 | Poor 97.8% |
| Immigrants | Northern Africa | 12.0 /100 | #208 | Poor 97.8% |
| Costa Ricans | 11.6 /100 | #209 | Poor 97.8% |
| Immigrants | Oceania | 11.1 /100 | #210 | Poor 97.8% |
| Laotians | 10.5 /100 | #211 | Poor 97.8% |
| Moroccans | 8.9 /100 | #212 | Tragic 97.8% |
| South American Indians | 7.7 /100 | #213 | Tragic 97.8% |
| Uruguayans | 7.5 /100 | #214 | Tragic 97.8% |
Demographics Similar to Hmong by Kindergarten
In terms of kindergarten, the demographic groups most similar to Hmong are Filipino (98.0%, a difference of 0.0%), Burmese (98.1%, a difference of 0.010%), Alsatian (98.1%, a difference of 0.010%), Immigrants from Israel (98.0%, a difference of 0.010%), and Palestinian (98.1%, a difference of 0.020%).
| Demographics | Rating | Rank | Kindergarten |
| Immigrants | Romania | 87.7 /100 | #138 | Excellent 98.1% |
| Israelis | 87.7 /100 | #139 | Excellent 98.1% |
| Palestinians | 83.6 /100 | #140 | Excellent 98.1% |
| Marshallese | 83.0 /100 | #141 | Excellent 98.1% |
| Immigrants | Turkey | 82.8 /100 | #142 | Excellent 98.1% |
| Burmese | 81.5 /100 | #143 | Excellent 98.1% |
| Alsatians | 80.4 /100 | #144 | Excellent 98.1% |
| Hmong | 78.8 /100 | #145 | Good 98.1% |
| Filipinos | 78.3 /100 | #146 | Good 98.0% |
| Immigrants | Israel | 77.6 /100 | #147 | Good 98.0% |
| Apache | 75.0 /100 | #148 | Good 98.0% |
| Immigrants | Greece | 74.9 /100 | #149 | Good 98.0% |
| Jordanians | 72.8 /100 | #150 | Good 98.0% |
| Soviet Union | 70.8 /100 | #151 | Good 98.0% |
| Dutch West Indians | 70.1 /100 | #152 | Good 98.0% |