Afghan vs Russian 2nd Grade
COMPARE
Afghan
Russian
2nd Grade
2nd Grade Comparison
Afghans
Russians
97.3%
2ND GRADE
0.1/ 100
METRIC RATING
280th/ 347
METRIC RANK
98.3%
2ND GRADE
99.7/ 100
METRIC RATING
68th/ 347
METRIC RANK
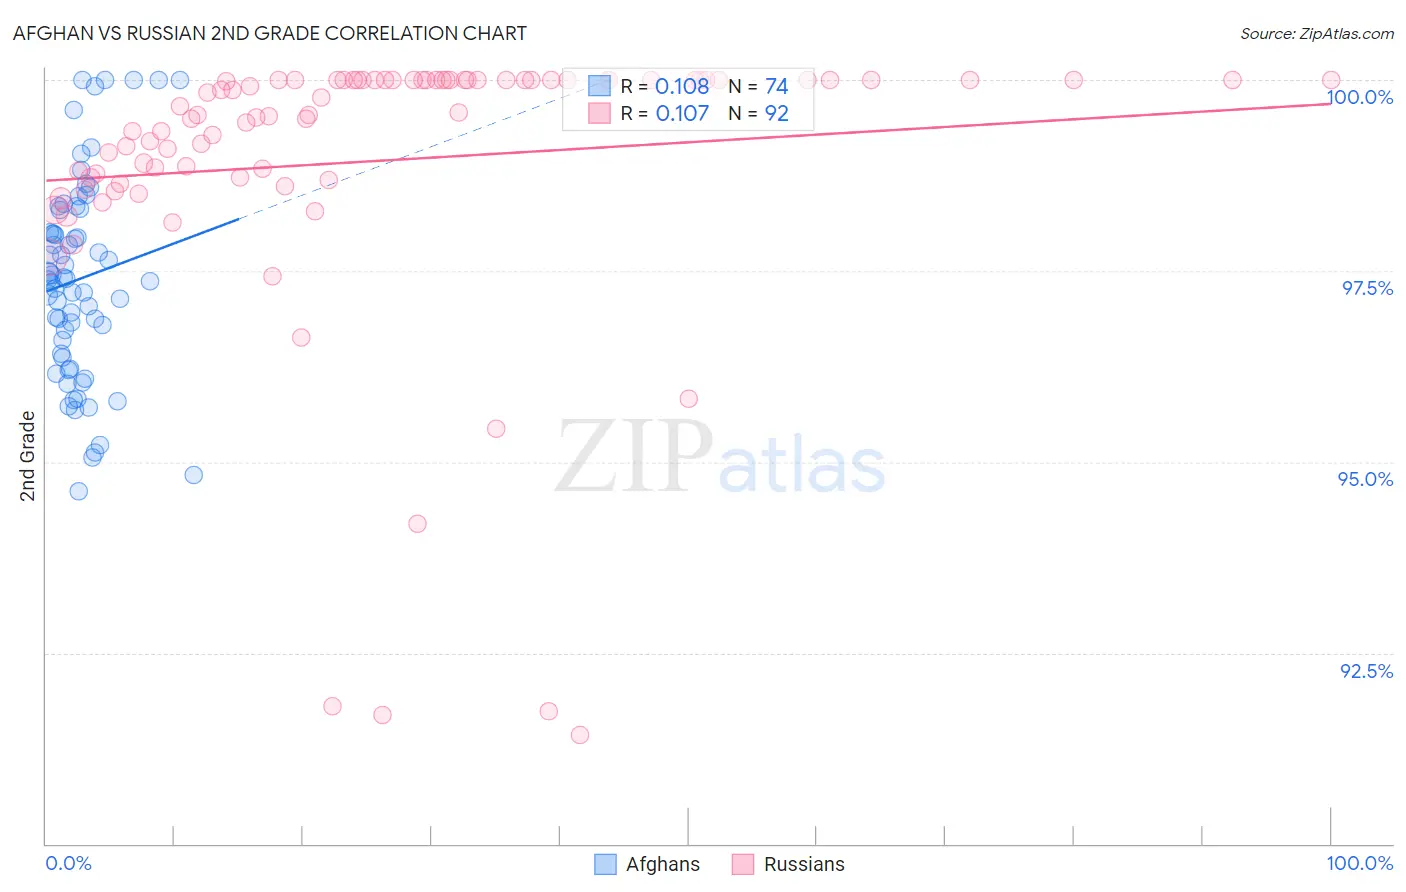
Afghan vs Russian 2nd Grade Correlation Chart
The statistical analysis conducted on geographies consisting of 148,851,685 people shows a poor positive correlation between the proportion of Afghans and percentage of population with at least 2nd grade education in the United States with a correlation coefficient (R) of 0.108 and weighted average of 97.3%. Similarly, the statistical analysis conducted on geographies consisting of 512,259,139 people shows a poor positive correlation between the proportion of Russians and percentage of population with at least 2nd grade education in the United States with a correlation coefficient (R) of 0.107 and weighted average of 98.3%, a difference of 1.0%.
2nd Grade Correlation Summary
| Measurement | Afghan | Russian |
| Minimum | 94.6% | 91.4% |
| Maximum | 100.0% | 100.0% |
| Range | 5.4% | 8.6% |
| Mean | 97.4% | 98.9% |
| Median | 97.4% | 99.6% |
| Interquartile 25% (IQ1) | 96.4% | 98.7% |
| Interquartile 75% (IQ3) | 98.3% | 100.0% |
| Interquartile Range (IQR) | 1.9% | 1.3% |
| Standard Deviation (Sample) | 1.3% | 1.9% |
| Standard Deviation (Population) | 1.3% | 1.9% |
Similar Demographics by 2nd Grade
Demographics Similar to Afghans by 2nd Grade
In terms of 2nd grade, the demographic groups most similar to Afghans are Immigrants from Ghana (97.3%, a difference of 0.0%), Trinidadian and Tobagonian (97.3%, a difference of 0.0%), Barbadian (97.3%, a difference of 0.010%), Immigrants from Western Africa (97.3%, a difference of 0.020%), and Immigrants from Uzbekistan (97.3%, a difference of 0.020%).
| Demographics | Rating | Rank | 2nd Grade |
| Immigrants | Bolivia | 0.1 /100 | #273 | Tragic 97.4% |
| Ghanaians | 0.1 /100 | #274 | Tragic 97.4% |
| Immigrants | China | 0.1 /100 | #275 | Tragic 97.3% |
| Immigrants | Philippines | 0.1 /100 | #276 | Tragic 97.3% |
| Immigrants | Western Africa | 0.1 /100 | #277 | Tragic 97.3% |
| Immigrants | Uzbekistan | 0.1 /100 | #278 | Tragic 97.3% |
| Immigrants | Ghana | 0.1 /100 | #279 | Tragic 97.3% |
| Afghans | 0.1 /100 | #280 | Tragic 97.3% |
| Trinidadians and Tobagonians | 0.1 /100 | #281 | Tragic 97.3% |
| Barbadians | 0.1 /100 | #282 | Tragic 97.3% |
| Immigrants | Trinidad and Tobago | 0.0 /100 | #283 | Tragic 97.2% |
| Immigrants | West Indies | 0.0 /100 | #284 | Tragic 97.2% |
| Immigrants | Hong Kong | 0.0 /100 | #285 | Tragic 97.2% |
| Immigrants | Barbados | 0.0 /100 | #286 | Tragic 97.2% |
| Immigrants | Portugal | 0.0 /100 | #287 | Tragic 97.2% |
Demographics Similar to Russians by 2nd Grade
In terms of 2nd grade, the demographic groups most similar to Russians are Canadian (98.3%, a difference of 0.0%), Immigrants from Northern Europe (98.3%, a difference of 0.0%), Immigrants from Austria (98.3%, a difference of 0.0%), Serbian (98.3%, a difference of 0.0%), and Chickasaw (98.3%, a difference of 0.010%).
| Demographics | Rating | Rank | 2nd Grade |
| Immigrants | Canada | 99.8 /100 | #61 | Exceptional 98.3% |
| Greeks | 99.8 /100 | #62 | Exceptional 98.3% |
| Maltese | 99.7 /100 | #63 | Exceptional 98.3% |
| Immigrants | North America | 99.7 /100 | #64 | Exceptional 98.3% |
| New Zealanders | 99.7 /100 | #65 | Exceptional 98.3% |
| Canadians | 99.7 /100 | #66 | Exceptional 98.3% |
| Immigrants | Northern Europe | 99.7 /100 | #67 | Exceptional 98.3% |
| Russians | 99.7 /100 | #68 | Exceptional 98.3% |
| Immigrants | Austria | 99.6 /100 | #69 | Exceptional 98.3% |
| Serbians | 99.6 /100 | #70 | Exceptional 98.3% |
| Chickasaw | 99.6 /100 | #71 | Exceptional 98.3% |
| Cheyenne | 99.6 /100 | #72 | Exceptional 98.3% |
| Cajuns | 99.5 /100 | #73 | Exceptional 98.3% |
| Immigrants | Netherlands | 99.4 /100 | #74 | Exceptional 98.3% |
| Shoshone | 99.4 /100 | #75 | Exceptional 98.3% |