Afghan vs Immigrants from Cambodia 8th Grade
COMPARE
Afghan
Immigrants from Cambodia
8th Grade
8th Grade Comparison
Afghans
Immigrants from Cambodia
94.9%
8TH GRADE
0.6/ 100
METRIC RATING
257th/ 347
METRIC RANK
93.3%
8TH GRADE
0.0/ 100
METRIC RATING
316th/ 347
METRIC RANK
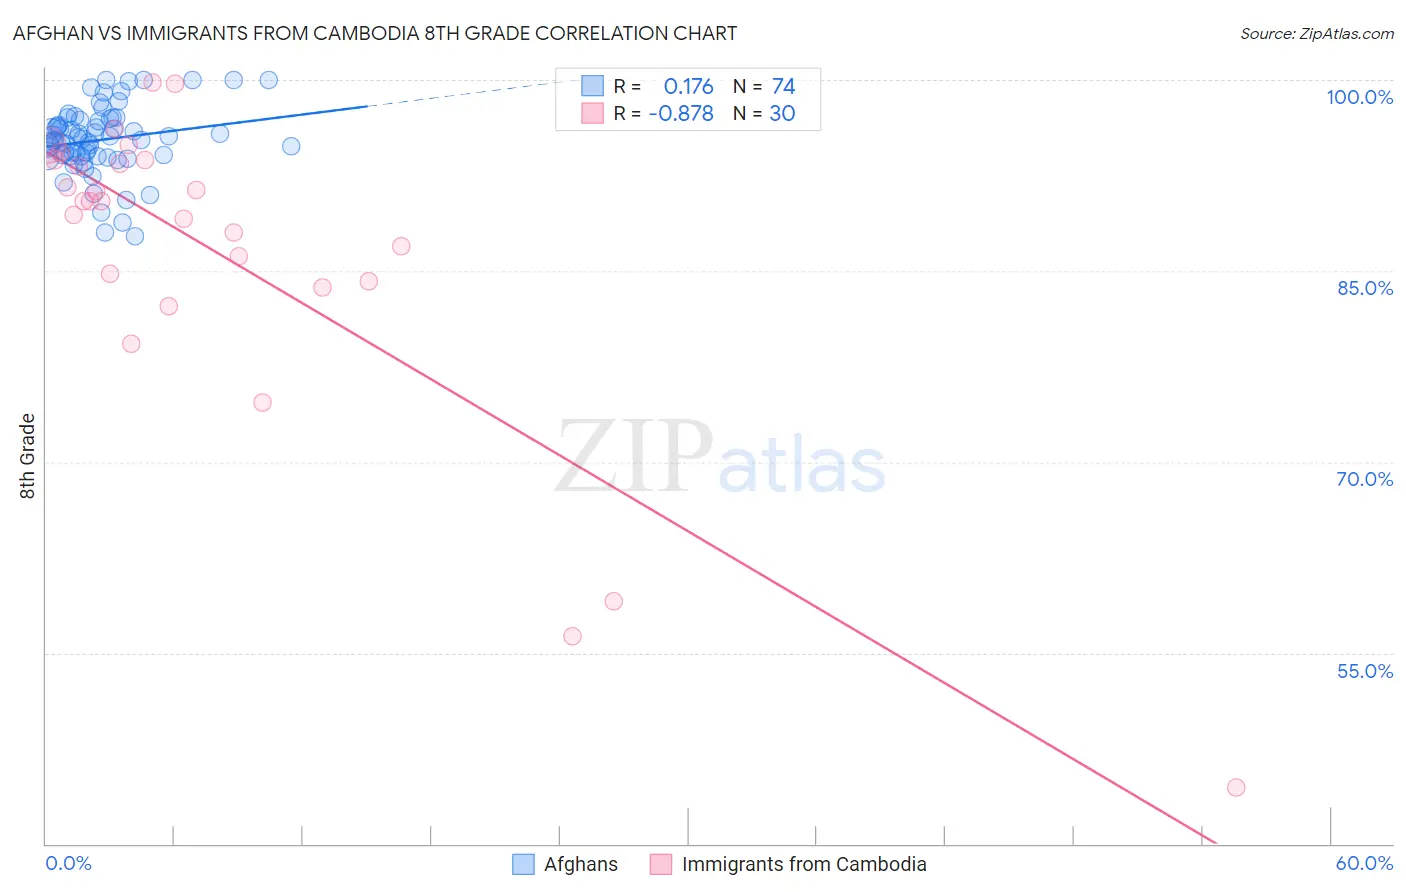
Afghan vs Immigrants from Cambodia 8th Grade Correlation Chart
The statistical analysis conducted on geographies consisting of 148,851,685 people shows a poor positive correlation between the proportion of Afghans and percentage of population with at least 8th grade education in the United States with a correlation coefficient (R) of 0.176 and weighted average of 94.9%. Similarly, the statistical analysis conducted on geographies consisting of 205,153,442 people shows a very strong negative correlation between the proportion of Immigrants from Cambodia and percentage of population with at least 8th grade education in the United States with a correlation coefficient (R) of -0.878 and weighted average of 93.3%, a difference of 1.8%.
8th Grade Correlation Summary
| Measurement | Afghan | Immigrants from Cambodia |
| Minimum | 87.7% | 44.4% |
| Maximum | 100.0% | 99.8% |
| Range | 12.3% | 55.4% |
| Mean | 95.3% | 86.3% |
| Median | 95.3% | 90.5% |
| Interquartile 25% (IQ1) | 94.1% | 84.2% |
| Interquartile 75% (IQ3) | 96.9% | 93.7% |
| Interquartile Range (IQR) | 2.8% | 9.5% |
| Standard Deviation (Sample) | 2.7% | 12.6% |
| Standard Deviation (Population) | 2.7% | 12.4% |
Similar Demographics by 8th Grade
Demographics Similar to Afghans by 8th Grade
In terms of 8th grade, the demographic groups most similar to Afghans are Colombian (95.0%, a difference of 0.010%), Immigrants from Congo (94.9%, a difference of 0.010%), Ghanaian (94.9%, a difference of 0.010%), Immigrants from Somalia (95.0%, a difference of 0.020%), and Immigrants from Jamaica (94.9%, a difference of 0.020%).
| Demographics | Rating | Rank | 8th Grade |
| Koreans | 1.1 /100 | #250 | Tragic 95.0% |
| Bolivians | 1.0 /100 | #251 | Tragic 95.0% |
| Immigrants | Ethiopia | 1.0 /100 | #252 | Tragic 95.0% |
| U.S. Virgin Islanders | 0.9 /100 | #253 | Tragic 95.0% |
| Immigrants | Cameroon | 0.8 /100 | #254 | Tragic 95.0% |
| Immigrants | Somalia | 0.7 /100 | #255 | Tragic 95.0% |
| Colombians | 0.7 /100 | #256 | Tragic 95.0% |
| Afghans | 0.6 /100 | #257 | Tragic 94.9% |
| Immigrants | Congo | 0.6 /100 | #258 | Tragic 94.9% |
| Ghanaians | 0.6 /100 | #259 | Tragic 94.9% |
| Immigrants | Jamaica | 0.6 /100 | #260 | Tragic 94.9% |
| Immigrants | Costa Rica | 0.5 /100 | #261 | Tragic 94.9% |
| Immigrants | Nigeria | 0.4 /100 | #262 | Tragic 94.9% |
| Immigrants | Hong Kong | 0.4 /100 | #263 | Tragic 94.9% |
| South Americans | 0.4 /100 | #264 | Tragic 94.9% |
Demographics Similar to Immigrants from Cambodia by 8th Grade
In terms of 8th grade, the demographic groups most similar to Immigrants from Cambodia are Immigrants from Ecuador (93.3%, a difference of 0.060%), Puerto Rican (93.2%, a difference of 0.060%), Immigrants from Cuba (93.2%, a difference of 0.10%), Immigrants from Fiji (93.2%, a difference of 0.12%), and Vietnamese (93.5%, a difference of 0.19%).
| Demographics | Rating | Rank | 8th Grade |
| Immigrants | Immigrants | 0.0 /100 | #309 | Tragic 93.6% |
| Japanese | 0.0 /100 | #310 | Tragic 93.6% |
| Immigrants | Bangladesh | 0.0 /100 | #311 | Tragic 93.6% |
| Cape Verdeans | 0.0 /100 | #312 | Tragic 93.5% |
| Immigrants | Caribbean | 0.0 /100 | #313 | Tragic 93.5% |
| Immigrants | Vietnam | 0.0 /100 | #314 | Tragic 93.5% |
| Vietnamese | 0.0 /100 | #315 | Tragic 93.5% |
| Immigrants | Cambodia | 0.0 /100 | #316 | Tragic 93.3% |
| Immigrants | Ecuador | 0.0 /100 | #317 | Tragic 93.3% |
| Puerto Ricans | 0.0 /100 | #318 | Tragic 93.2% |
| Immigrants | Cuba | 0.0 /100 | #319 | Tragic 93.2% |
| Immigrants | Fiji | 0.0 /100 | #320 | Tragic 93.2% |
| Belizeans | 0.0 /100 | #321 | Tragic 93.1% |
| Nicaraguans | 0.0 /100 | #322 | Tragic 93.0% |
| Immigrants | Belize | 0.0 /100 | #323 | Tragic 92.9% |