Immigrants from Kenya vs Immigrants from Cambodia 8th Grade
COMPARE
Immigrants from Kenya
Immigrants from Cambodia
8th Grade
8th Grade Comparison
Immigrants from Kenya
Immigrants from Cambodia
95.8%
8TH GRADE
67.2/ 100
METRIC RATING
162nd/ 347
METRIC RANK
93.3%
8TH GRADE
0.0/ 100
METRIC RATING
316th/ 347
METRIC RANK
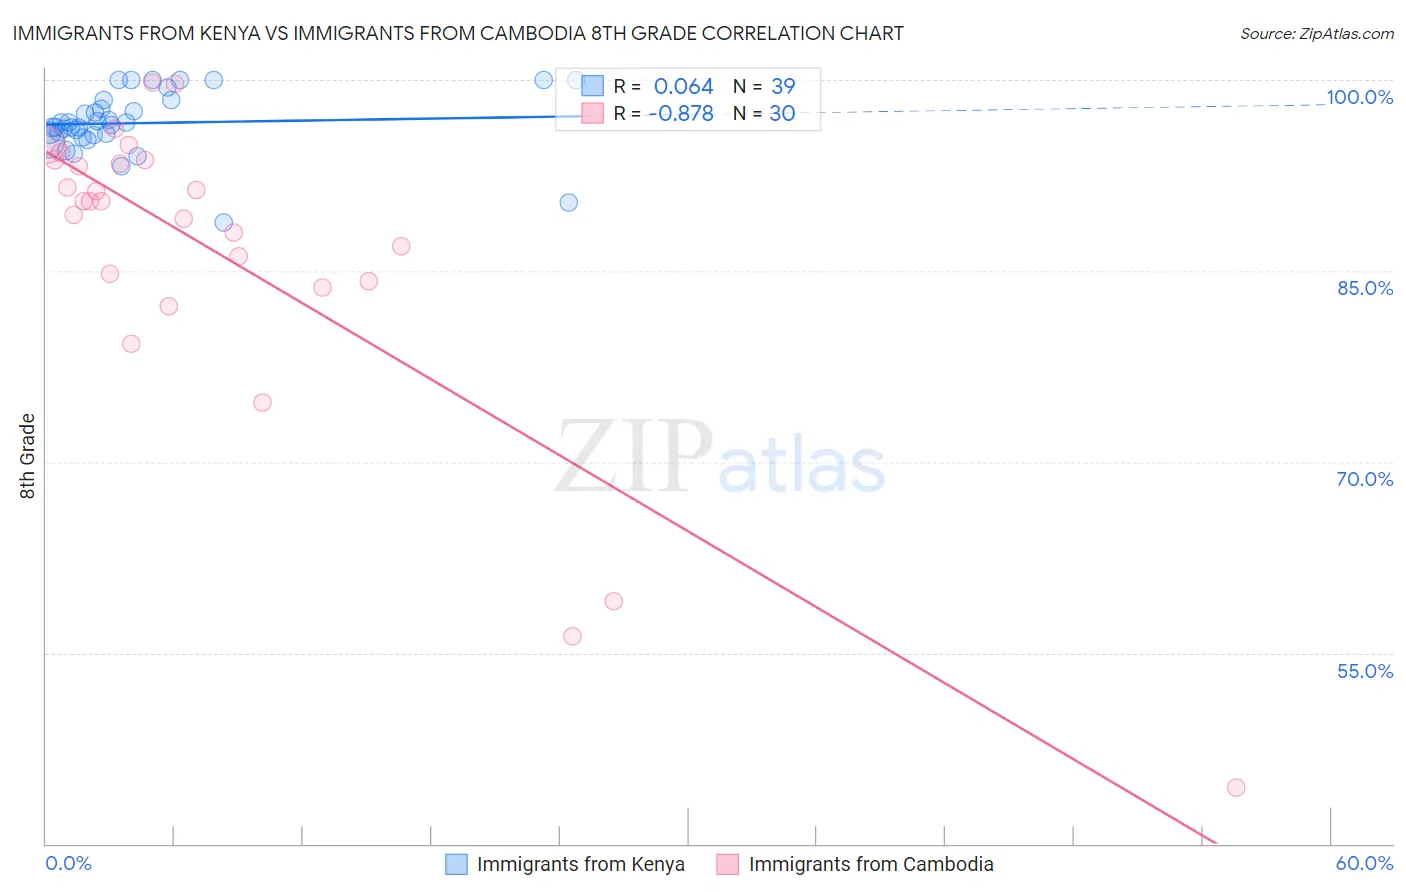
Immigrants from Kenya vs Immigrants from Cambodia 8th Grade Correlation Chart
The statistical analysis conducted on geographies consisting of 218,076,690 people shows a slight positive correlation between the proportion of Immigrants from Kenya and percentage of population with at least 8th grade education in the United States with a correlation coefficient (R) of 0.064 and weighted average of 95.8%. Similarly, the statistical analysis conducted on geographies consisting of 205,153,442 people shows a very strong negative correlation between the proportion of Immigrants from Cambodia and percentage of population with at least 8th grade education in the United States with a correlation coefficient (R) of -0.878 and weighted average of 93.3%, a difference of 2.7%.
8th Grade Correlation Summary
| Measurement | Immigrants from Kenya | Immigrants from Cambodia |
| Minimum | 88.8% | 44.4% |
| Maximum | 100.0% | 99.8% |
| Range | 11.2% | 55.4% |
| Mean | 96.6% | 86.3% |
| Median | 96.4% | 90.5% |
| Interquartile 25% (IQ1) | 95.7% | 84.2% |
| Interquartile 75% (IQ3) | 98.5% | 93.7% |
| Interquartile Range (IQR) | 2.8% | 9.5% |
| Standard Deviation (Sample) | 2.5% | 12.6% |
| Standard Deviation (Population) | 2.5% | 12.4% |
Similar Demographics by 8th Grade
Demographics Similar to Immigrants from Kenya by 8th Grade
In terms of 8th grade, the demographic groups most similar to Immigrants from Kenya are Seminole (95.8%, a difference of 0.0%), Bermudan (95.8%, a difference of 0.0%), Immigrants from Kazakhstan (95.9%, a difference of 0.010%), Arab (95.9%, a difference of 0.020%), and Immigrants from Sri Lanka (95.8%, a difference of 0.020%).
| Demographics | Rating | Rank | 8th Grade |
| Kenyans | 74.5 /100 | #155 | Good 95.9% |
| Ugandans | 74.1 /100 | #156 | Good 95.9% |
| Immigrants | Taiwan | 70.5 /100 | #157 | Good 95.9% |
| Arabs | 69.4 /100 | #158 | Good 95.9% |
| Immigrants | Kazakhstan | 68.4 /100 | #159 | Good 95.9% |
| Seminole | 67.7 /100 | #160 | Good 95.8% |
| Bermudans | 67.5 /100 | #161 | Good 95.8% |
| Immigrants | Kenya | 67.2 /100 | #162 | Good 95.8% |
| Immigrants | Sri Lanka | 64.1 /100 | #163 | Good 95.8% |
| Immigrants | Italy | 63.5 /100 | #164 | Good 95.8% |
| Alsatians | 61.4 /100 | #165 | Good 95.8% |
| Immigrants | Poland | 61.1 /100 | #166 | Good 95.8% |
| Spaniards | 60.0 /100 | #167 | Good 95.8% |
| Immigrants | Ukraine | 59.5 /100 | #168 | Average 95.8% |
| Immigrants | Iran | 58.6 /100 | #169 | Average 95.8% |
Demographics Similar to Immigrants from Cambodia by 8th Grade
In terms of 8th grade, the demographic groups most similar to Immigrants from Cambodia are Immigrants from Ecuador (93.3%, a difference of 0.060%), Puerto Rican (93.2%, a difference of 0.060%), Immigrants from Cuba (93.2%, a difference of 0.10%), Immigrants from Fiji (93.2%, a difference of 0.12%), and Vietnamese (93.5%, a difference of 0.19%).
| Demographics | Rating | Rank | 8th Grade |
| Immigrants | Immigrants | 0.0 /100 | #309 | Tragic 93.6% |
| Japanese | 0.0 /100 | #310 | Tragic 93.6% |
| Immigrants | Bangladesh | 0.0 /100 | #311 | Tragic 93.6% |
| Cape Verdeans | 0.0 /100 | #312 | Tragic 93.5% |
| Immigrants | Caribbean | 0.0 /100 | #313 | Tragic 93.5% |
| Immigrants | Vietnam | 0.0 /100 | #314 | Tragic 93.5% |
| Vietnamese | 0.0 /100 | #315 | Tragic 93.5% |
| Immigrants | Cambodia | 0.0 /100 | #316 | Tragic 93.3% |
| Immigrants | Ecuador | 0.0 /100 | #317 | Tragic 93.3% |
| Puerto Ricans | 0.0 /100 | #318 | Tragic 93.2% |
| Immigrants | Cuba | 0.0 /100 | #319 | Tragic 93.2% |
| Immigrants | Fiji | 0.0 /100 | #320 | Tragic 93.2% |
| Belizeans | 0.0 /100 | #321 | Tragic 93.1% |
| Nicaraguans | 0.0 /100 | #322 | Tragic 93.0% |
| Immigrants | Belize | 0.0 /100 | #323 | Tragic 92.9% |