Trinidadian and Tobagonian vs Immigrants from Cambodia 8th Grade
COMPARE
Trinidadian and Tobagonian
Immigrants from Cambodia
8th Grade
8th Grade Comparison
Trinidadians and Tobagonians
Immigrants from Cambodia
94.7%
8TH GRADE
0.2/ 100
METRIC RATING
274th/ 347
METRIC RANK
93.3%
8TH GRADE
0.0/ 100
METRIC RATING
316th/ 347
METRIC RANK
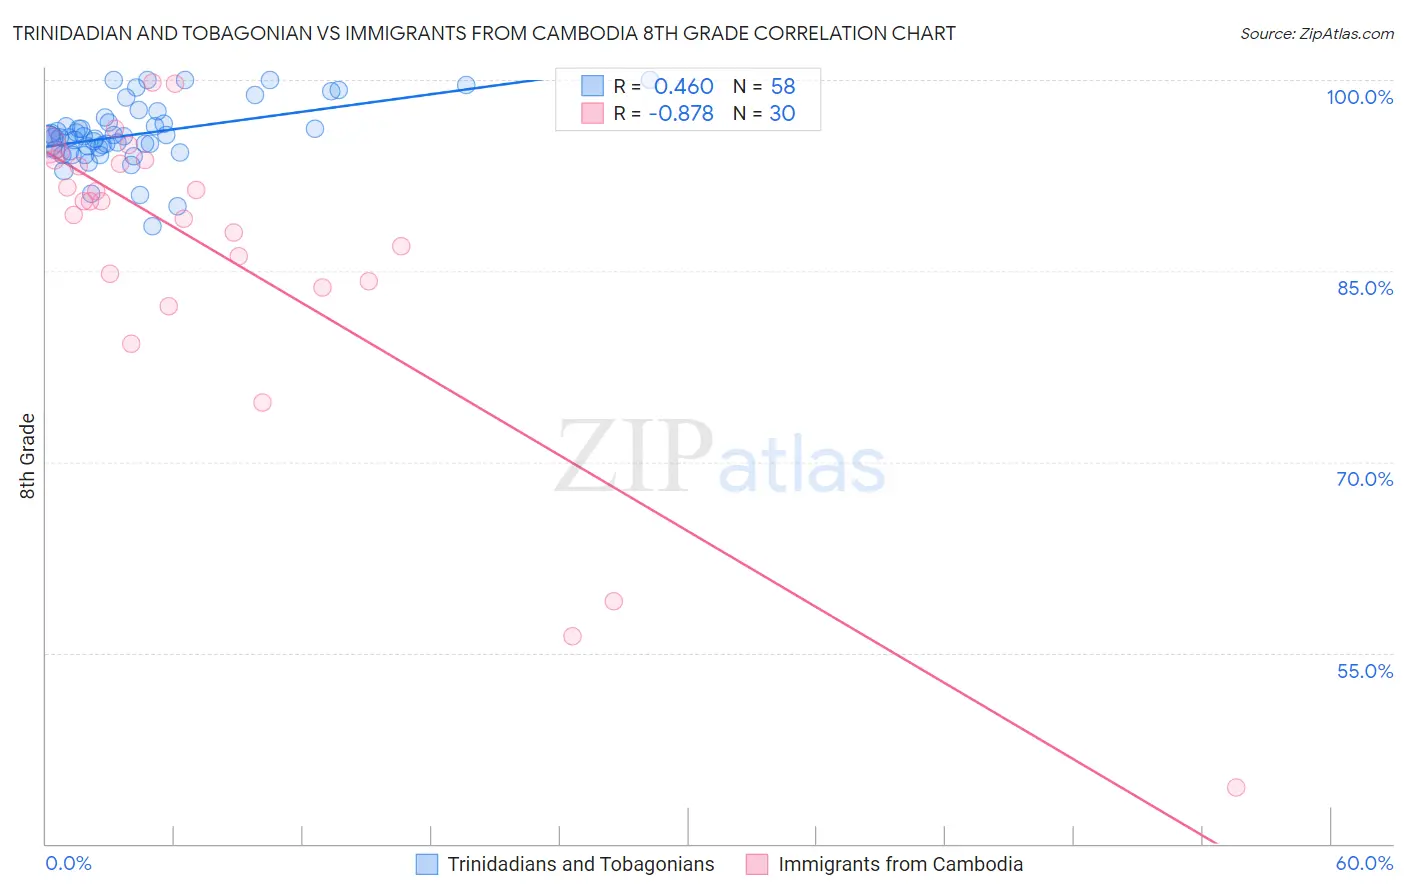
Trinidadian and Tobagonian vs Immigrants from Cambodia 8th Grade Correlation Chart
The statistical analysis conducted on geographies consisting of 219,881,170 people shows a moderate positive correlation between the proportion of Trinidadians and Tobagonians and percentage of population with at least 8th grade education in the United States with a correlation coefficient (R) of 0.460 and weighted average of 94.7%. Similarly, the statistical analysis conducted on geographies consisting of 205,153,442 people shows a very strong negative correlation between the proportion of Immigrants from Cambodia and percentage of population with at least 8th grade education in the United States with a correlation coefficient (R) of -0.878 and weighted average of 93.3%, a difference of 1.5%.
8th Grade Correlation Summary
| Measurement | Trinidadian and Tobagonian | Immigrants from Cambodia |
| Minimum | 88.5% | 44.4% |
| Maximum | 100.0% | 99.8% |
| Range | 11.5% | 55.4% |
| Mean | 95.8% | 86.3% |
| Median | 95.5% | 90.5% |
| Interquartile 25% (IQ1) | 94.5% | 84.2% |
| Interquartile 75% (IQ3) | 96.7% | 93.7% |
| Interquartile Range (IQR) | 2.2% | 9.5% |
| Standard Deviation (Sample) | 2.5% | 12.6% |
| Standard Deviation (Population) | 2.4% | 12.4% |
Similar Demographics by 8th Grade
Demographics Similar to Trinidadians and Tobagonians by 8th Grade
In terms of 8th grade, the demographic groups most similar to Trinidadians and Tobagonians are Immigrants from Western Africa (94.8%, a difference of 0.010%), Immigrants from Colombia (94.7%, a difference of 0.010%), Immigrants from South America (94.8%, a difference of 0.020%), Immigrants from Uzbekistan (94.8%, a difference of 0.030%), and Immigrants from Afghanistan (94.8%, a difference of 0.030%).
| Demographics | Rating | Rank | 8th Grade |
| Immigrants | Ghana | 0.3 /100 | #267 | Tragic 94.8% |
| Immigrants | Uruguay | 0.3 /100 | #268 | Tragic 94.8% |
| Immigrants | Thailand | 0.2 /100 | #269 | Tragic 94.8% |
| Immigrants | Uzbekistan | 0.2 /100 | #270 | Tragic 94.8% |
| Immigrants | Afghanistan | 0.2 /100 | #271 | Tragic 94.8% |
| Immigrants | South America | 0.2 /100 | #272 | Tragic 94.8% |
| Immigrants | Western Africa | 0.2 /100 | #273 | Tragic 94.8% |
| Trinidadians and Tobagonians | 0.2 /100 | #274 | Tragic 94.7% |
| Immigrants | Colombia | 0.2 /100 | #275 | Tragic 94.7% |
| Peruvians | 0.1 /100 | #276 | Tragic 94.7% |
| Taiwanese | 0.1 /100 | #277 | Tragic 94.7% |
| Armenians | 0.1 /100 | #278 | Tragic 94.7% |
| Immigrants | Trinidad and Tobago | 0.1 /100 | #279 | Tragic 94.6% |
| Barbadians | 0.1 /100 | #280 | Tragic 94.6% |
| Immigrants | Bolivia | 0.1 /100 | #281 | Tragic 94.6% |
Demographics Similar to Immigrants from Cambodia by 8th Grade
In terms of 8th grade, the demographic groups most similar to Immigrants from Cambodia are Immigrants from Ecuador (93.3%, a difference of 0.060%), Puerto Rican (93.2%, a difference of 0.060%), Immigrants from Cuba (93.2%, a difference of 0.10%), Immigrants from Fiji (93.2%, a difference of 0.12%), and Vietnamese (93.5%, a difference of 0.19%).
| Demographics | Rating | Rank | 8th Grade |
| Immigrants | Immigrants | 0.0 /100 | #309 | Tragic 93.6% |
| Japanese | 0.0 /100 | #310 | Tragic 93.6% |
| Immigrants | Bangladesh | 0.0 /100 | #311 | Tragic 93.6% |
| Cape Verdeans | 0.0 /100 | #312 | Tragic 93.5% |
| Immigrants | Caribbean | 0.0 /100 | #313 | Tragic 93.5% |
| Immigrants | Vietnam | 0.0 /100 | #314 | Tragic 93.5% |
| Vietnamese | 0.0 /100 | #315 | Tragic 93.5% |
| Immigrants | Cambodia | 0.0 /100 | #316 | Tragic 93.3% |
| Immigrants | Ecuador | 0.0 /100 | #317 | Tragic 93.3% |
| Puerto Ricans | 0.0 /100 | #318 | Tragic 93.2% |
| Immigrants | Cuba | 0.0 /100 | #319 | Tragic 93.2% |
| Immigrants | Fiji | 0.0 /100 | #320 | Tragic 93.2% |
| Belizeans | 0.0 /100 | #321 | Tragic 93.1% |
| Nicaraguans | 0.0 /100 | #322 | Tragic 93.0% |
| Immigrants | Belize | 0.0 /100 | #323 | Tragic 92.9% |