Afghan vs Nepalese 8th Grade
COMPARE
Afghan
Nepalese
8th Grade
8th Grade Comparison
Afghans
Nepalese
94.9%
8TH GRADE
0.6/ 100
METRIC RATING
257th/ 347
METRIC RANK
92.8%
8TH GRADE
0.0/ 100
METRIC RATING
324th/ 347
METRIC RANK
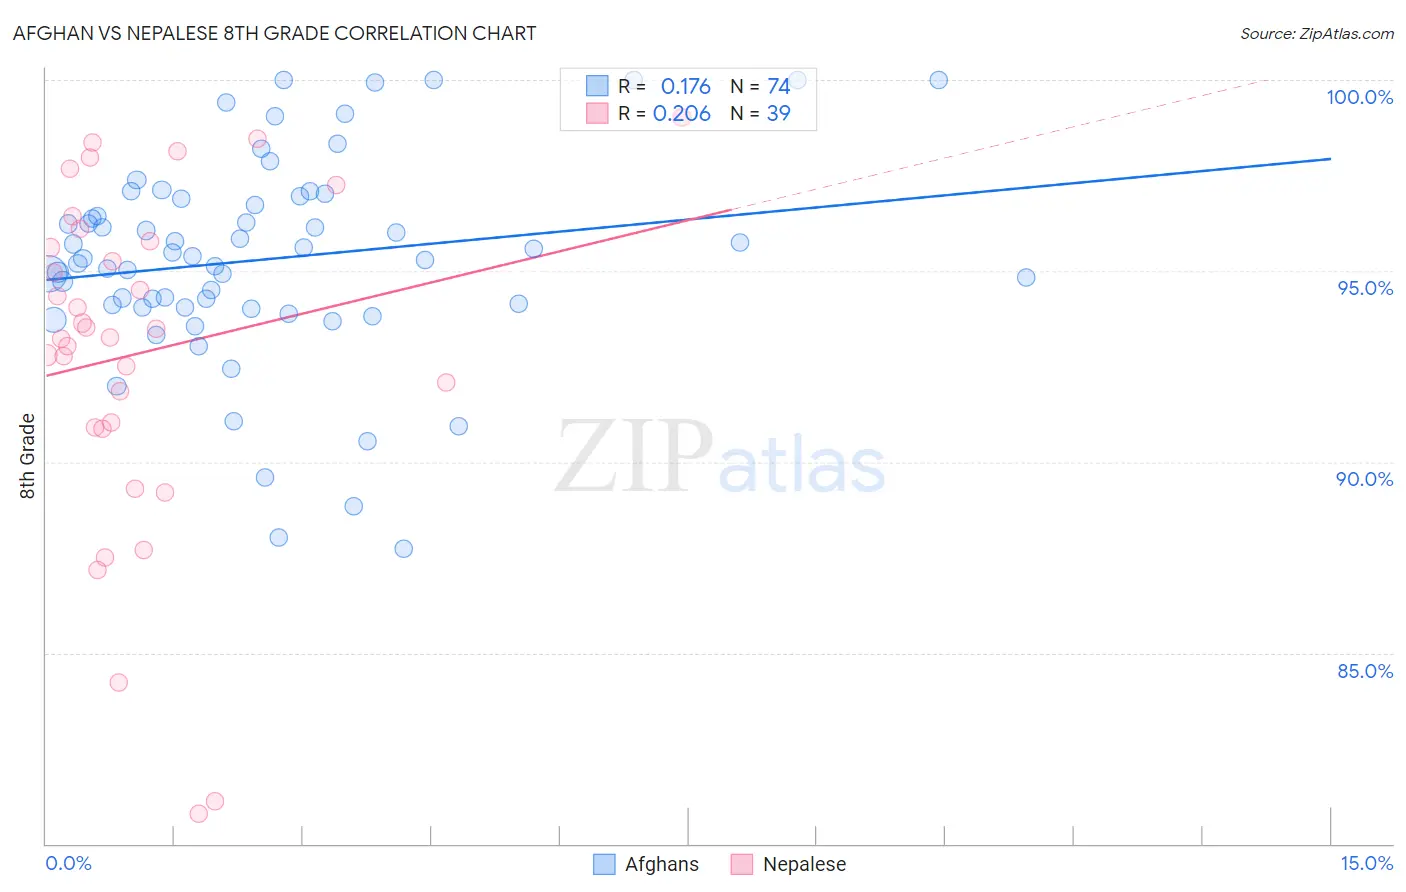
Afghan vs Nepalese 8th Grade Correlation Chart
The statistical analysis conducted on geographies consisting of 148,851,685 people shows a poor positive correlation between the proportion of Afghans and percentage of population with at least 8th grade education in the United States with a correlation coefficient (R) of 0.176 and weighted average of 94.9%. Similarly, the statistical analysis conducted on geographies consisting of 24,519,269 people shows a weak positive correlation between the proportion of Nepalese and percentage of population with at least 8th grade education in the United States with a correlation coefficient (R) of 0.206 and weighted average of 92.8%, a difference of 2.3%.
8th Grade Correlation Summary
| Measurement | Afghan | Nepalese |
| Minimum | 87.7% | 80.8% |
| Maximum | 100.0% | 99.0% |
| Range | 12.3% | 18.2% |
| Mean | 95.3% | 92.9% |
| Median | 95.3% | 93.5% |
| Interquartile 25% (IQ1) | 94.1% | 90.9% |
| Interquartile 75% (IQ3) | 96.9% | 96.1% |
| Interquartile Range (IQR) | 2.8% | 5.2% |
| Standard Deviation (Sample) | 2.7% | 4.5% |
| Standard Deviation (Population) | 2.7% | 4.5% |
Similar Demographics by 8th Grade
Demographics Similar to Afghans by 8th Grade
In terms of 8th grade, the demographic groups most similar to Afghans are Colombian (95.0%, a difference of 0.010%), Immigrants from Congo (94.9%, a difference of 0.010%), Ghanaian (94.9%, a difference of 0.010%), Immigrants from Somalia (95.0%, a difference of 0.020%), and Immigrants from Jamaica (94.9%, a difference of 0.020%).
| Demographics | Rating | Rank | 8th Grade |
| Koreans | 1.1 /100 | #250 | Tragic 95.0% |
| Bolivians | 1.0 /100 | #251 | Tragic 95.0% |
| Immigrants | Ethiopia | 1.0 /100 | #252 | Tragic 95.0% |
| U.S. Virgin Islanders | 0.9 /100 | #253 | Tragic 95.0% |
| Immigrants | Cameroon | 0.8 /100 | #254 | Tragic 95.0% |
| Immigrants | Somalia | 0.7 /100 | #255 | Tragic 95.0% |
| Colombians | 0.7 /100 | #256 | Tragic 95.0% |
| Afghans | 0.6 /100 | #257 | Tragic 94.9% |
| Immigrants | Congo | 0.6 /100 | #258 | Tragic 94.9% |
| Ghanaians | 0.6 /100 | #259 | Tragic 94.9% |
| Immigrants | Jamaica | 0.6 /100 | #260 | Tragic 94.9% |
| Immigrants | Costa Rica | 0.5 /100 | #261 | Tragic 94.9% |
| Immigrants | Nigeria | 0.4 /100 | #262 | Tragic 94.9% |
| Immigrants | Hong Kong | 0.4 /100 | #263 | Tragic 94.9% |
| South Americans | 0.4 /100 | #264 | Tragic 94.9% |
Demographics Similar to Nepalese by 8th Grade
In terms of 8th grade, the demographic groups most similar to Nepalese are Immigrants from Belize (92.9%, a difference of 0.070%), Dominican (92.8%, a difference of 0.090%), Nicaraguan (93.0%, a difference of 0.12%), Central American Indian (92.7%, a difference of 0.14%), and Belizean (93.1%, a difference of 0.24%).
| Demographics | Rating | Rank | 8th Grade |
| Immigrants | Ecuador | 0.0 /100 | #317 | Tragic 93.3% |
| Puerto Ricans | 0.0 /100 | #318 | Tragic 93.2% |
| Immigrants | Cuba | 0.0 /100 | #319 | Tragic 93.2% |
| Immigrants | Fiji | 0.0 /100 | #320 | Tragic 93.2% |
| Belizeans | 0.0 /100 | #321 | Tragic 93.1% |
| Nicaraguans | 0.0 /100 | #322 | Tragic 93.0% |
| Immigrants | Belize | 0.0 /100 | #323 | Tragic 92.9% |
| Nepalese | 0.0 /100 | #324 | Tragic 92.8% |
| Dominicans | 0.0 /100 | #325 | Tragic 92.8% |
| Central American Indians | 0.0 /100 | #326 | Tragic 92.7% |
| Immigrants | Azores | 0.0 /100 | #327 | Tragic 92.5% |
| Immigrants | Nicaragua | 0.0 /100 | #328 | Tragic 92.5% |
| Immigrants | Cabo Verde | 0.0 /100 | #329 | Tragic 92.4% |
| Immigrants | Armenia | 0.0 /100 | #330 | Tragic 92.3% |
| Hondurans | 0.0 /100 | #331 | Tragic 92.3% |