Afghan vs Immigrants from Austria 8th Grade
COMPARE
Afghan
Immigrants from Austria
8th Grade
8th Grade Comparison
Afghans
Immigrants from Austria
94.9%
8TH GRADE
0.6/ 100
METRIC RATING
257th/ 347
METRIC RANK
96.7%
8TH GRADE
99.8/ 100
METRIC RATING
61st/ 347
METRIC RANK
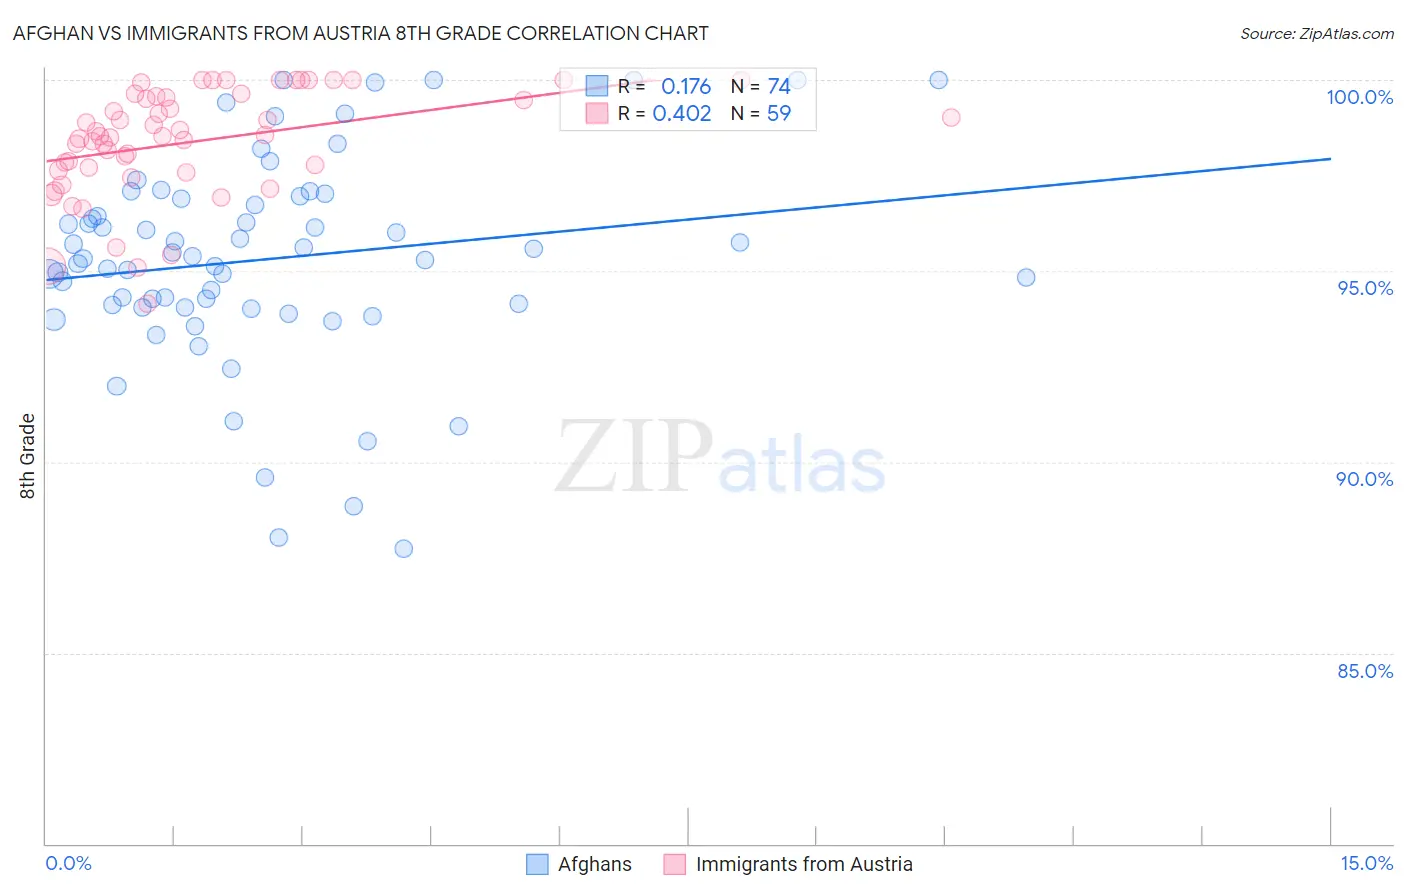
Afghan vs Immigrants from Austria 8th Grade Correlation Chart
The statistical analysis conducted on geographies consisting of 148,851,685 people shows a poor positive correlation between the proportion of Afghans and percentage of population with at least 8th grade education in the United States with a correlation coefficient (R) of 0.176 and weighted average of 94.9%. Similarly, the statistical analysis conducted on geographies consisting of 167,973,800 people shows a moderate positive correlation between the proportion of Immigrants from Austria and percentage of population with at least 8th grade education in the United States with a correlation coefficient (R) of 0.402 and weighted average of 96.7%, a difference of 1.8%.
8th Grade Correlation Summary
| Measurement | Afghan | Immigrants from Austria |
| Minimum | 87.7% | 94.1% |
| Maximum | 100.0% | 100.0% |
| Range | 12.3% | 5.9% |
| Mean | 95.3% | 98.4% |
| Median | 95.3% | 98.5% |
| Interquartile 25% (IQ1) | 94.1% | 97.6% |
| Interquartile 75% (IQ3) | 96.9% | 99.6% |
| Interquartile Range (IQR) | 2.8% | 1.9% |
| Standard Deviation (Sample) | 2.7% | 1.4% |
| Standard Deviation (Population) | 2.7% | 1.4% |
Similar Demographics by 8th Grade
Demographics Similar to Afghans by 8th Grade
In terms of 8th grade, the demographic groups most similar to Afghans are Colombian (95.0%, a difference of 0.010%), Immigrants from Congo (94.9%, a difference of 0.010%), Ghanaian (94.9%, a difference of 0.010%), Immigrants from Somalia (95.0%, a difference of 0.020%), and Immigrants from Jamaica (94.9%, a difference of 0.020%).
| Demographics | Rating | Rank | 8th Grade |
| Koreans | 1.1 /100 | #250 | Tragic 95.0% |
| Bolivians | 1.0 /100 | #251 | Tragic 95.0% |
| Immigrants | Ethiopia | 1.0 /100 | #252 | Tragic 95.0% |
| U.S. Virgin Islanders | 0.9 /100 | #253 | Tragic 95.0% |
| Immigrants | Cameroon | 0.8 /100 | #254 | Tragic 95.0% |
| Immigrants | Somalia | 0.7 /100 | #255 | Tragic 95.0% |
| Colombians | 0.7 /100 | #256 | Tragic 95.0% |
| Afghans | 0.6 /100 | #257 | Tragic 94.9% |
| Immigrants | Congo | 0.6 /100 | #258 | Tragic 94.9% |
| Ghanaians | 0.6 /100 | #259 | Tragic 94.9% |
| Immigrants | Jamaica | 0.6 /100 | #260 | Tragic 94.9% |
| Immigrants | Costa Rica | 0.5 /100 | #261 | Tragic 94.9% |
| Immigrants | Nigeria | 0.4 /100 | #262 | Tragic 94.9% |
| Immigrants | Hong Kong | 0.4 /100 | #263 | Tragic 94.9% |
| South Americans | 0.4 /100 | #264 | Tragic 94.9% |
Demographics Similar to Immigrants from Austria by 8th Grade
In terms of 8th grade, the demographic groups most similar to Immigrants from Austria are Immigrants from Northern Europe (96.7%, a difference of 0.0%), Immigrants from North America (96.7%, a difference of 0.010%), White/Caucasian (96.7%, a difference of 0.010%), Immigrants from Canada (96.7%, a difference of 0.020%), and Ukrainian (96.7%, a difference of 0.030%).
| Demographics | Rating | Rank | 8th Grade |
| Serbians | 99.8 /100 | #54 | Exceptional 96.7% |
| Russians | 99.8 /100 | #55 | Exceptional 96.7% |
| Australians | 99.8 /100 | #56 | Exceptional 96.7% |
| Macedonians | 99.8 /100 | #57 | Exceptional 96.7% |
| Immigrants | Canada | 99.8 /100 | #58 | Exceptional 96.7% |
| Immigrants | North America | 99.8 /100 | #59 | Exceptional 96.7% |
| Immigrants | Northern Europe | 99.8 /100 | #60 | Exceptional 96.7% |
| Immigrants | Austria | 99.8 /100 | #61 | Exceptional 96.7% |
| Whites/Caucasians | 99.8 /100 | #62 | Exceptional 96.7% |
| Ukrainians | 99.7 /100 | #63 | Exceptional 96.7% |
| Immigrants | India | 99.7 /100 | #64 | Exceptional 96.6% |
| Native Hawaiians | 99.7 /100 | #65 | Exceptional 96.6% |
| Canadians | 99.7 /100 | #66 | Exceptional 96.6% |
| Iranians | 99.7 /100 | #67 | Exceptional 96.6% |
| Creek | 99.7 /100 | #68 | Exceptional 96.6% |