Afghan vs Laotian 8th Grade
COMPARE
Afghan
Laotian
8th Grade
8th Grade Comparison
Afghans
Laotians
94.9%
8TH GRADE
0.6/ 100
METRIC RATING
257th/ 347
METRIC RANK
95.4%
8TH GRADE
9.0/ 100
METRIC RATING
213th/ 347
METRIC RANK
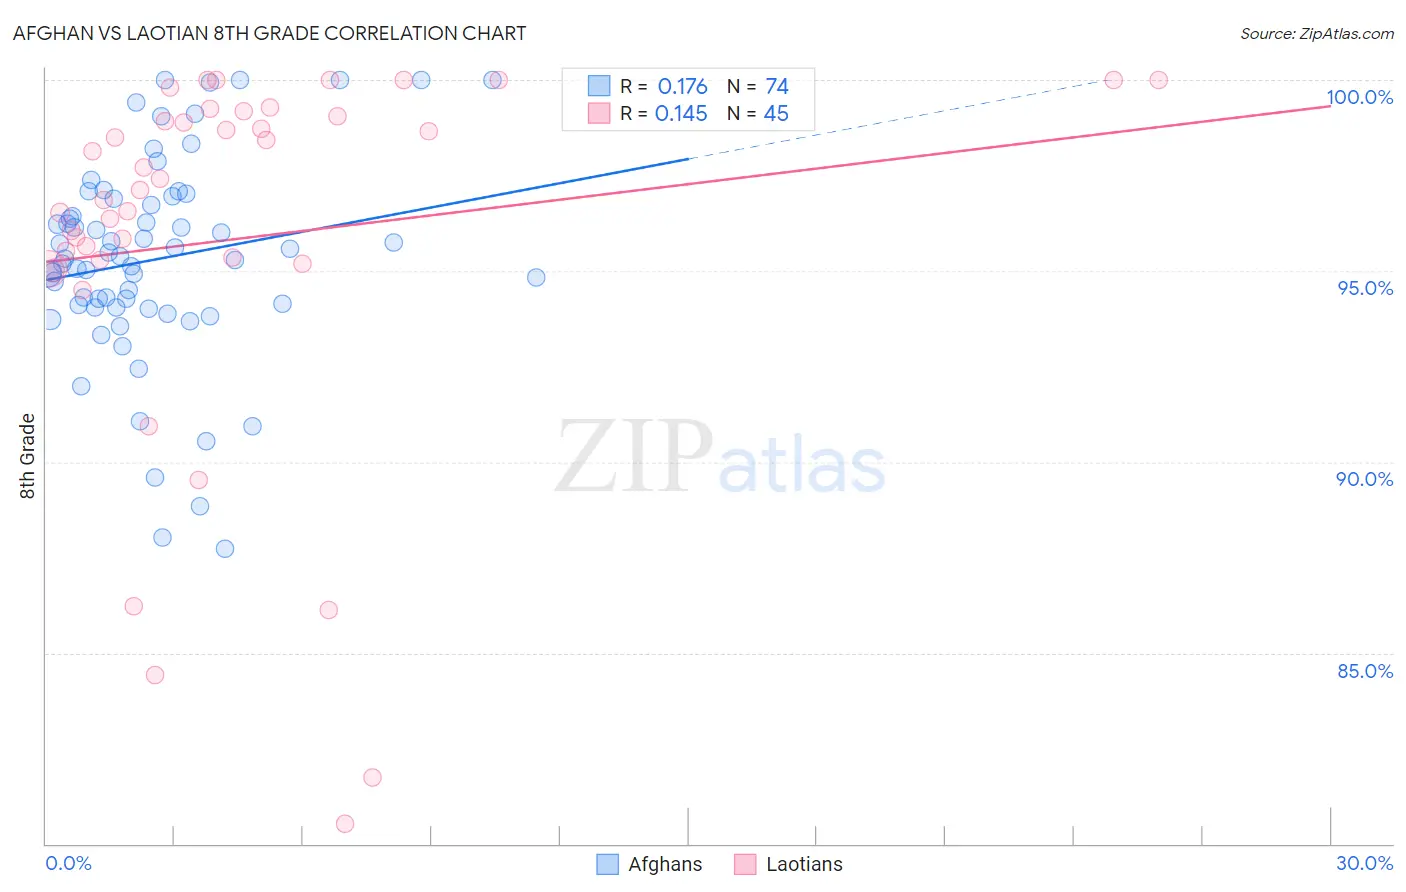
Afghan vs Laotian 8th Grade Correlation Chart
The statistical analysis conducted on geographies consisting of 148,851,685 people shows a poor positive correlation between the proportion of Afghans and percentage of population with at least 8th grade education in the United States with a correlation coefficient (R) of 0.176 and weighted average of 94.9%. Similarly, the statistical analysis conducted on geographies consisting of 224,856,886 people shows a poor positive correlation between the proportion of Laotians and percentage of population with at least 8th grade education in the United States with a correlation coefficient (R) of 0.145 and weighted average of 95.4%, a difference of 0.45%.
8th Grade Correlation Summary
| Measurement | Afghan | Laotian |
| Minimum | 87.7% | 80.5% |
| Maximum | 100.0% | 100.0% |
| Range | 12.3% | 19.5% |
| Mean | 95.3% | 95.8% |
| Median | 95.3% | 97.1% |
| Interquartile 25% (IQ1) | 94.1% | 95.2% |
| Interquartile 75% (IQ3) | 96.9% | 99.1% |
| Interquartile Range (IQR) | 2.8% | 3.9% |
| Standard Deviation (Sample) | 2.7% | 4.9% |
| Standard Deviation (Population) | 2.7% | 4.9% |
Similar Demographics by 8th Grade
Demographics Similar to Afghans by 8th Grade
In terms of 8th grade, the demographic groups most similar to Afghans are Colombian (95.0%, a difference of 0.010%), Immigrants from Congo (94.9%, a difference of 0.010%), Ghanaian (94.9%, a difference of 0.010%), Immigrants from Somalia (95.0%, a difference of 0.020%), and Immigrants from Jamaica (94.9%, a difference of 0.020%).
| Demographics | Rating | Rank | 8th Grade |
| Koreans | 1.1 /100 | #250 | Tragic 95.0% |
| Bolivians | 1.0 /100 | #251 | Tragic 95.0% |
| Immigrants | Ethiopia | 1.0 /100 | #252 | Tragic 95.0% |
| U.S. Virgin Islanders | 0.9 /100 | #253 | Tragic 95.0% |
| Immigrants | Cameroon | 0.8 /100 | #254 | Tragic 95.0% |
| Immigrants | Somalia | 0.7 /100 | #255 | Tragic 95.0% |
| Colombians | 0.7 /100 | #256 | Tragic 95.0% |
| Afghans | 0.6 /100 | #257 | Tragic 94.9% |
| Immigrants | Congo | 0.6 /100 | #258 | Tragic 94.9% |
| Ghanaians | 0.6 /100 | #259 | Tragic 94.9% |
| Immigrants | Jamaica | 0.6 /100 | #260 | Tragic 94.9% |
| Immigrants | Costa Rica | 0.5 /100 | #261 | Tragic 94.9% |
| Immigrants | Nigeria | 0.4 /100 | #262 | Tragic 94.9% |
| Immigrants | Hong Kong | 0.4 /100 | #263 | Tragic 94.9% |
| South Americans | 0.4 /100 | #264 | Tragic 94.9% |
Demographics Similar to Laotians by 8th Grade
In terms of 8th grade, the demographic groups most similar to Laotians are Immigrants from Chile (95.4%, a difference of 0.0%), Immigrants from Liberia (95.4%, a difference of 0.0%), Immigrants from Pakistan (95.4%, a difference of 0.010%), Samoan (95.4%, a difference of 0.010%), and Immigrants from Eastern Asia (95.4%, a difference of 0.020%).
| Demographics | Rating | Rank | 8th Grade |
| Comanche | 16.3 /100 | #206 | Poor 95.5% |
| Immigrants | Sudan | 15.1 /100 | #207 | Poor 95.5% |
| Portuguese | 14.3 /100 | #208 | Poor 95.5% |
| Immigrants | Lebanon | 13.7 /100 | #209 | Poor 95.4% |
| Africans | 13.6 /100 | #210 | Poor 95.4% |
| Immigrants | Morocco | 12.4 /100 | #211 | Poor 95.4% |
| Immigrants | Pakistan | 9.7 /100 | #212 | Tragic 95.4% |
| Laotians | 9.0 /100 | #213 | Tragic 95.4% |
| Immigrants | Chile | 9.0 /100 | #214 | Tragic 95.4% |
| Immigrants | Liberia | 8.9 /100 | #215 | Tragic 95.4% |
| Samoans | 8.4 /100 | #216 | Tragic 95.4% |
| Immigrants | Eastern Asia | 8.3 /100 | #217 | Tragic 95.4% |
| Dutch West Indians | 8.1 /100 | #218 | Tragic 95.4% |
| Spanish Americans | 8.0 /100 | #219 | Tragic 95.4% |
| Immigrants | Southern Europe | 7.7 /100 | #220 | Tragic 95.3% |