Nigerian vs Immigrants from Cambodia 8th Grade
COMPARE
Nigerian
Immigrants from Cambodia
8th Grade
8th Grade Comparison
Nigerians
Immigrants from Cambodia
95.2%
8TH GRADE
2.9/ 100
METRIC RATING
235th/ 347
METRIC RANK
93.3%
8TH GRADE
0.0/ 100
METRIC RATING
316th/ 347
METRIC RANK
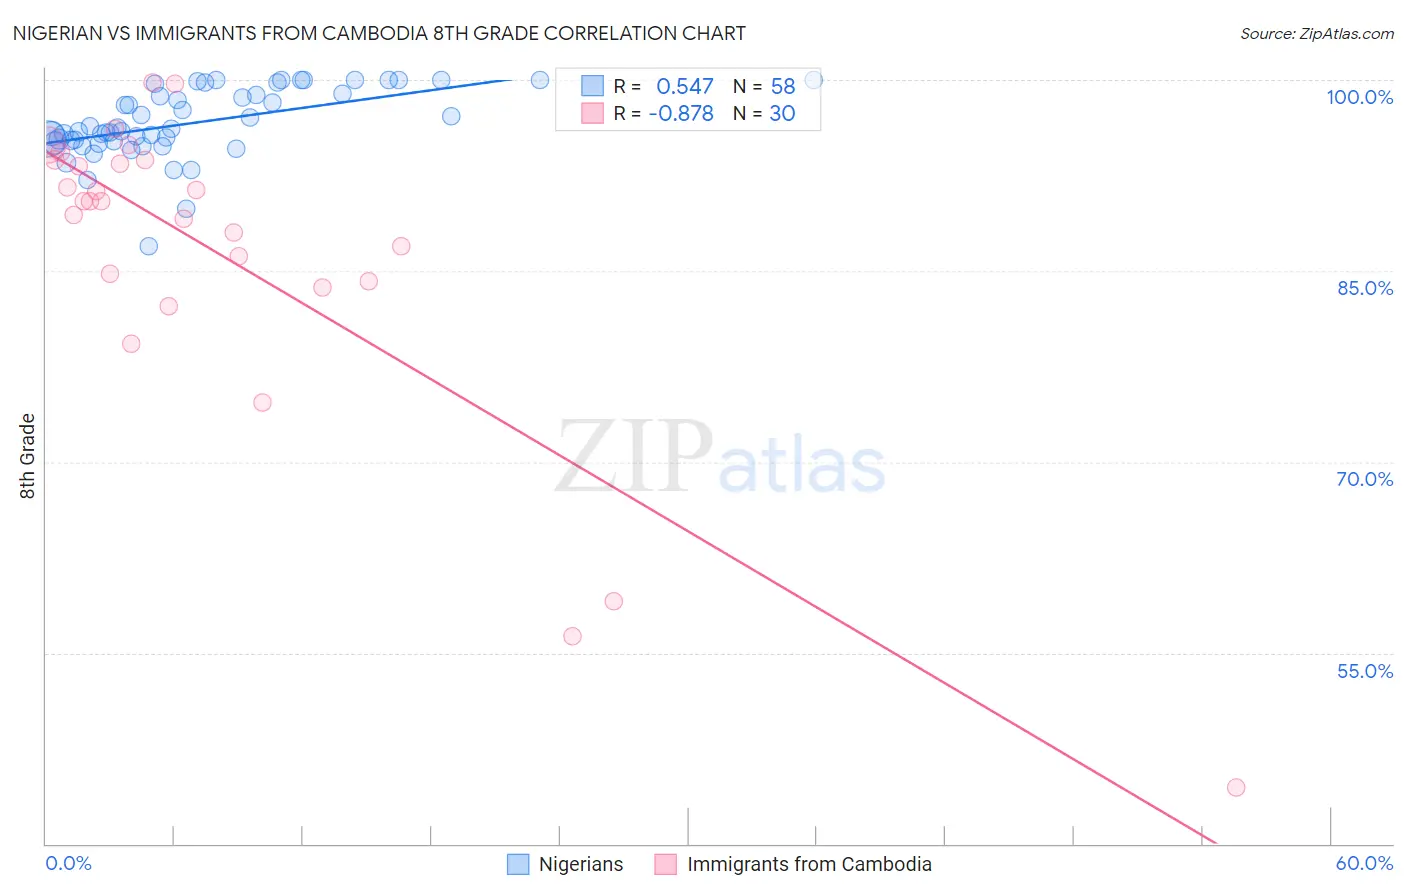
Nigerian vs Immigrants from Cambodia 8th Grade Correlation Chart
The statistical analysis conducted on geographies consisting of 332,724,627 people shows a substantial positive correlation between the proportion of Nigerians and percentage of population with at least 8th grade education in the United States with a correlation coefficient (R) of 0.547 and weighted average of 95.2%. Similarly, the statistical analysis conducted on geographies consisting of 205,153,442 people shows a very strong negative correlation between the proportion of Immigrants from Cambodia and percentage of population with at least 8th grade education in the United States with a correlation coefficient (R) of -0.878 and weighted average of 93.3%, a difference of 2.0%.
8th Grade Correlation Summary
| Measurement | Nigerian | Immigrants from Cambodia |
| Minimum | 87.0% | 44.4% |
| Maximum | 100.0% | 99.8% |
| Range | 13.0% | 55.4% |
| Mean | 96.6% | 86.3% |
| Median | 96.1% | 90.5% |
| Interquartile 25% (IQ1) | 95.2% | 84.2% |
| Interquartile 75% (IQ3) | 98.9% | 93.7% |
| Interquartile Range (IQR) | 3.8% | 9.5% |
| Standard Deviation (Sample) | 2.7% | 12.6% |
| Standard Deviation (Population) | 2.7% | 12.4% |
Similar Demographics by 8th Grade
Demographics Similar to Nigerians by 8th Grade
In terms of 8th grade, the demographic groups most similar to Nigerians are Immigrants from Asia (95.2%, a difference of 0.010%), Costa Rican (95.2%, a difference of 0.010%), Senegalese (95.2%, a difference of 0.010%), Indian (Asian) (95.2%, a difference of 0.020%), and Immigrants from Africa (95.2%, a difference of 0.020%).
| Demographics | Rating | Rank | 8th Grade |
| Immigrants | Eastern Africa | 5.6 /100 | #228 | Tragic 95.3% |
| Immigrants | Indonesia | 4.4 /100 | #229 | Tragic 95.3% |
| Immigrants | Panama | 4.1 /100 | #230 | Tragic 95.2% |
| Asians | 3.5 /100 | #231 | Tragic 95.2% |
| Indians (Asian) | 3.3 /100 | #232 | Tragic 95.2% |
| Immigrants | Asia | 3.1 /100 | #233 | Tragic 95.2% |
| Costa Ricans | 3.0 /100 | #234 | Tragic 95.2% |
| Nigerians | 2.9 /100 | #235 | Tragic 95.2% |
| Senegalese | 2.7 /100 | #236 | Tragic 95.2% |
| Immigrants | Africa | 2.7 /100 | #237 | Tragic 95.2% |
| Natives/Alaskans | 2.3 /100 | #238 | Tragic 95.2% |
| Immigrants | Sierra Leone | 2.1 /100 | #239 | Tragic 95.1% |
| Ethiopians | 2.0 /100 | #240 | Tragic 95.1% |
| South American Indians | 1.9 /100 | #241 | Tragic 95.1% |
| Tongans | 1.7 /100 | #242 | Tragic 95.1% |
Demographics Similar to Immigrants from Cambodia by 8th Grade
In terms of 8th grade, the demographic groups most similar to Immigrants from Cambodia are Immigrants from Ecuador (93.3%, a difference of 0.060%), Puerto Rican (93.2%, a difference of 0.060%), Immigrants from Cuba (93.2%, a difference of 0.10%), Immigrants from Fiji (93.2%, a difference of 0.12%), and Vietnamese (93.5%, a difference of 0.19%).
| Demographics | Rating | Rank | 8th Grade |
| Immigrants | Immigrants | 0.0 /100 | #309 | Tragic 93.6% |
| Japanese | 0.0 /100 | #310 | Tragic 93.6% |
| Immigrants | Bangladesh | 0.0 /100 | #311 | Tragic 93.6% |
| Cape Verdeans | 0.0 /100 | #312 | Tragic 93.5% |
| Immigrants | Caribbean | 0.0 /100 | #313 | Tragic 93.5% |
| Immigrants | Vietnam | 0.0 /100 | #314 | Tragic 93.5% |
| Vietnamese | 0.0 /100 | #315 | Tragic 93.5% |
| Immigrants | Cambodia | 0.0 /100 | #316 | Tragic 93.3% |
| Immigrants | Ecuador | 0.0 /100 | #317 | Tragic 93.3% |
| Puerto Ricans | 0.0 /100 | #318 | Tragic 93.2% |
| Immigrants | Cuba | 0.0 /100 | #319 | Tragic 93.2% |
| Immigrants | Fiji | 0.0 /100 | #320 | Tragic 93.2% |
| Belizeans | 0.0 /100 | #321 | Tragic 93.1% |
| Nicaraguans | 0.0 /100 | #322 | Tragic 93.0% |
| Immigrants | Belize | 0.0 /100 | #323 | Tragic 92.9% |