Afghan vs Immigrants from Cabo Verde Vision Disability
COMPARE
Afghan
Immigrants from Cabo Verde
Vision Disability
Vision Disability Comparison
Afghans
Immigrants from Cabo Verde
2.0%
VISION DISABILITY
99.5/ 100
METRIC RATING
50th/ 347
METRIC RANK
2.6%
VISION DISABILITY
0.0/ 100
METRIC RATING
303rd/ 347
METRIC RANK
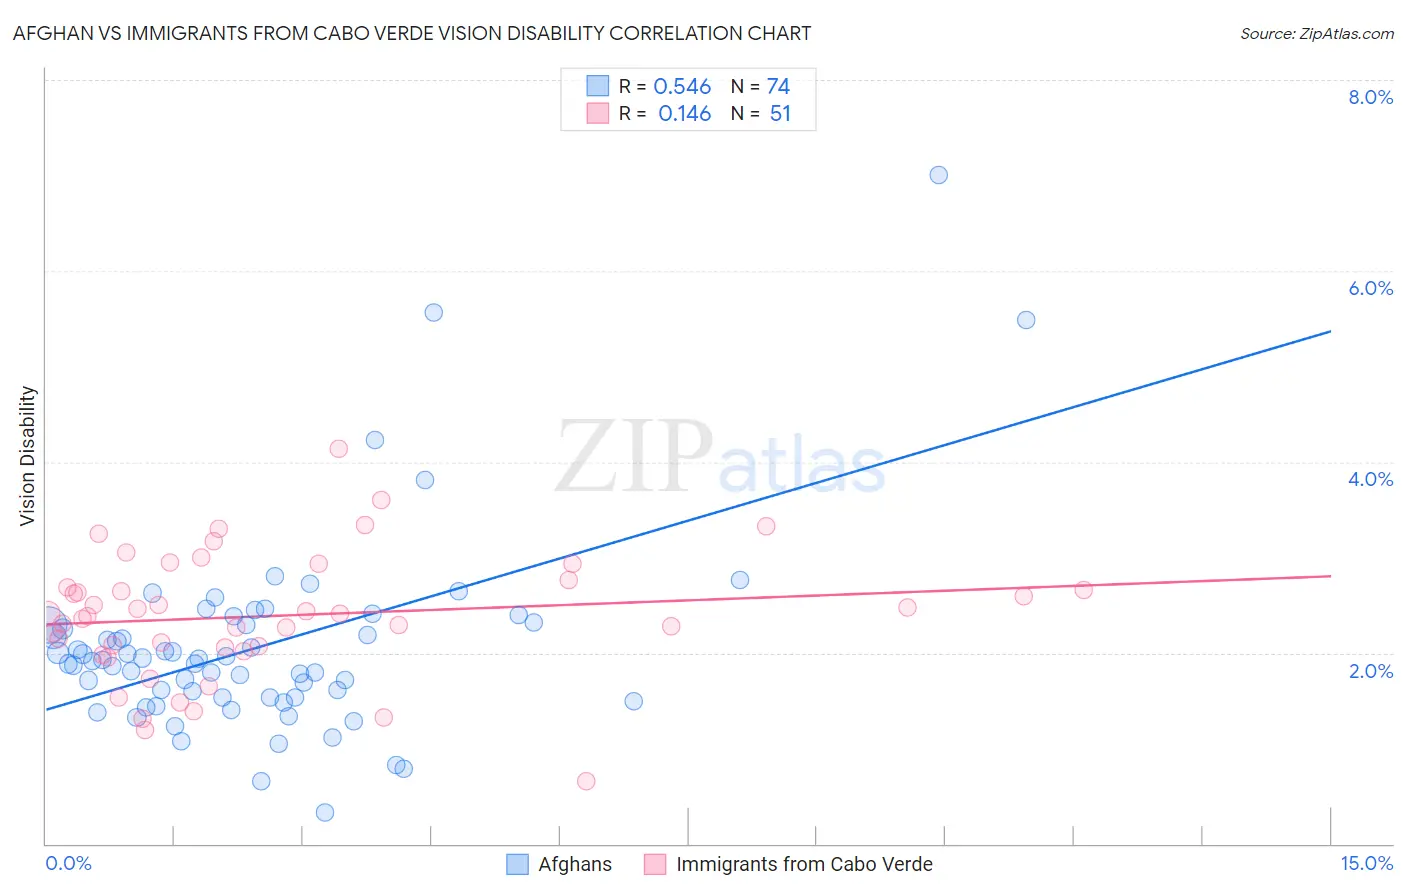
Afghan vs Immigrants from Cabo Verde Vision Disability Correlation Chart
The statistical analysis conducted on geographies consisting of 148,842,568 people shows a substantial positive correlation between the proportion of Afghans and percentage of population with vision disability in the United States with a correlation coefficient (R) of 0.546 and weighted average of 2.0%. Similarly, the statistical analysis conducted on geographies consisting of 38,135,099 people shows a poor positive correlation between the proportion of Immigrants from Cabo Verde and percentage of population with vision disability in the United States with a correlation coefficient (R) of 0.146 and weighted average of 2.6%, a difference of 30.0%.
Vision Disability Correlation Summary
| Measurement | Afghan | Immigrants from Cabo Verde |
| Minimum | 0.32% | 0.65% |
| Maximum | 7.0% | 4.1% |
| Range | 6.7% | 3.5% |
| Mean | 2.1% | 2.4% |
| Median | 1.9% | 2.4% |
| Interquartile 25% (IQ1) | 1.5% | 2.1% |
| Interquartile 75% (IQ3) | 2.3% | 2.8% |
| Interquartile Range (IQR) | 0.76% | 0.70% |
| Standard Deviation (Sample) | 1.0% | 0.67% |
| Standard Deviation (Population) | 1.0% | 0.66% |
Similar Demographics by Vision Disability
Demographics Similar to Afghans by Vision Disability
In terms of vision disability, the demographic groups most similar to Afghans are Latvian (2.0%, a difference of 0.060%), Tongan (2.0%, a difference of 0.090%), Israeli (2.0%, a difference of 0.13%), Immigrants from Serbia (2.0%, a difference of 0.40%), and Immigrants from Belarus (2.0%, a difference of 0.51%).
| Demographics | Rating | Rank | Vision Disability |
| Eastern Europeans | 99.7 /100 | #43 | Exceptional 2.0% |
| Immigrants | Indonesia | 99.7 /100 | #44 | Exceptional 2.0% |
| Ethiopians | 99.7 /100 | #45 | Exceptional 2.0% |
| Immigrants | Sweden | 99.7 /100 | #46 | Exceptional 2.0% |
| Immigrants | Bulgaria | 99.7 /100 | #47 | Exceptional 2.0% |
| Israelis | 99.6 /100 | #48 | Exceptional 2.0% |
| Latvians | 99.5 /100 | #49 | Exceptional 2.0% |
| Afghans | 99.5 /100 | #50 | Exceptional 2.0% |
| Tongans | 99.5 /100 | #51 | Exceptional 2.0% |
| Immigrants | Serbia | 99.4 /100 | #52 | Exceptional 2.0% |
| Immigrants | Belarus | 99.3 /100 | #53 | Exceptional 2.0% |
| Macedonians | 99.3 /100 | #54 | Exceptional 2.0% |
| Laotians | 99.3 /100 | #55 | Exceptional 2.0% |
| Jordanians | 99.2 /100 | #56 | Exceptional 2.0% |
| Somalis | 99.2 /100 | #57 | Exceptional 2.0% |
Demographics Similar to Immigrants from Cabo Verde by Vision Disability
In terms of vision disability, the demographic groups most similar to Immigrants from Cabo Verde are Aleut (2.6%, a difference of 0.13%), Spanish American Indian (2.6%, a difference of 0.22%), Hispanic or Latino (2.6%, a difference of 0.43%), Iroquois (2.6%, a difference of 1.1%), and Immigrants from Dominican Republic (2.6%, a difference of 1.1%).
| Demographics | Rating | Rank | Vision Disability |
| Immigrants | Mexico | 0.0 /100 | #296 | Tragic 2.5% |
| Immigrants | Dominica | 0.0 /100 | #297 | Tragic 2.5% |
| Mexicans | 0.0 /100 | #298 | Tragic 2.5% |
| Cree | 0.0 /100 | #299 | Tragic 2.5% |
| Africans | 0.0 /100 | #300 | Tragic 2.5% |
| Menominee | 0.0 /100 | #301 | Tragic 2.5% |
| Spanish American Indians | 0.0 /100 | #302 | Tragic 2.6% |
| Immigrants | Cabo Verde | 0.0 /100 | #303 | Tragic 2.6% |
| Aleuts | 0.0 /100 | #304 | Tragic 2.6% |
| Hispanics or Latinos | 0.0 /100 | #305 | Tragic 2.6% |
| Iroquois | 0.0 /100 | #306 | Tragic 2.6% |
| Immigrants | Dominican Republic | 0.0 /100 | #307 | Tragic 2.6% |
| Arapaho | 0.0 /100 | #308 | Tragic 2.6% |
| Immigrants | Yemen | 0.0 /100 | #309 | Tragic 2.6% |
| Blackfeet | 0.0 /100 | #310 | Tragic 2.6% |