Yuman vs Tsimshian Cognitive Disability
COMPARE
Yuman
Tsimshian
Cognitive Disability
Cognitive Disability Comparison
Yuman
Tsimshian
18.1%
COGNITIVE DISABILITY
0.2/ 100
METRIC RATING
276th/ 347
METRIC RANK
17.3%
COGNITIVE DISABILITY
49.8/ 100
METRIC RATING
175th/ 347
METRIC RANK
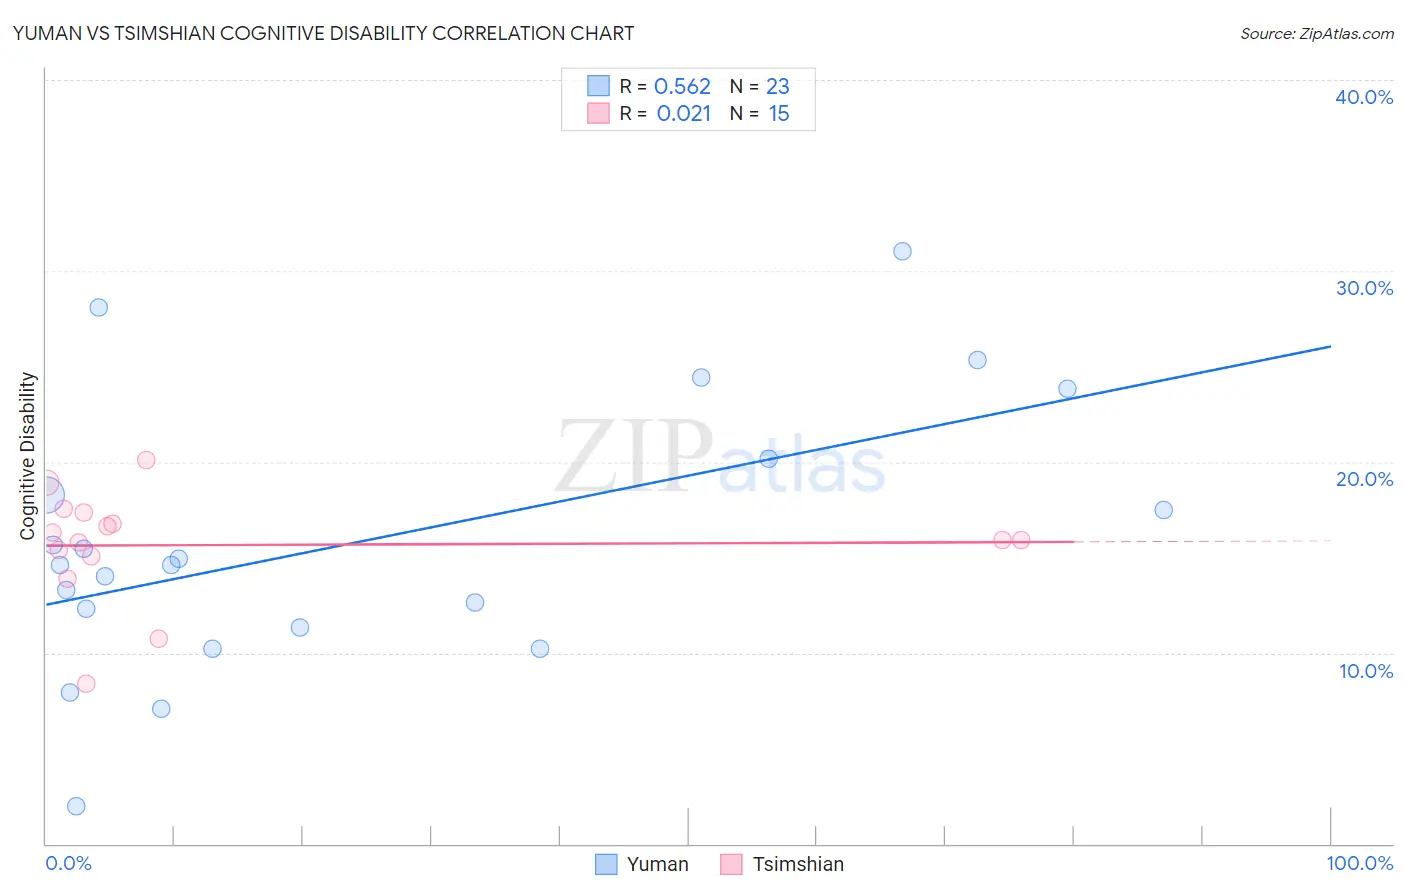
Yuman vs Tsimshian Cognitive Disability Correlation Chart
The statistical analysis conducted on geographies consisting of 40,663,643 people shows a substantial positive correlation between the proportion of Yuman and percentage of population with cognitive disability in the United States with a correlation coefficient (R) of 0.562 and weighted average of 18.1%. Similarly, the statistical analysis conducted on geographies consisting of 15,626,544 people shows no correlation between the proportion of Tsimshian and percentage of population with cognitive disability in the United States with a correlation coefficient (R) of 0.021 and weighted average of 17.3%, a difference of 4.6%.
Cognitive Disability Correlation Summary
| Measurement | Yuman | Tsimshian |
| Minimum | 1.9% | 8.4% |
| Maximum | 31.0% | 20.1% |
| Range | 29.1% | 11.8% |
| Mean | 15.9% | 15.6% |
| Median | 14.6% | 15.9% |
| Interquartile 25% (IQ1) | 11.3% | 15.1% |
| Interquartile 75% (IQ3) | 20.2% | 17.3% |
| Interquartile Range (IQR) | 8.9% | 2.3% |
| Standard Deviation (Sample) | 7.0% | 2.9% |
| Standard Deviation (Population) | 6.9% | 2.8% |
Similar Demographics by Cognitive Disability
Demographics Similar to Yuman by Cognitive Disability
In terms of cognitive disability, the demographic groups most similar to Yuman are Immigrants from Kuwait (18.1%, a difference of 0.0%), Immigrants from Micronesia (18.1%, a difference of 0.010%), Immigrants from Laos (18.1%, a difference of 0.040%), Chippewa (18.1%, a difference of 0.060%), and West Indian (18.1%, a difference of 0.070%).
| Demographics | Rating | Rank | Cognitive Disability |
| Hondurans | 0.3 /100 | #269 | Tragic 18.0% |
| Immigrants | Bahamas | 0.3 /100 | #270 | Tragic 18.0% |
| Potawatomi | 0.2 /100 | #271 | Tragic 18.0% |
| Immigrants | Honduras | 0.2 /100 | #272 | Tragic 18.0% |
| Immigrants | Nepal | 0.2 /100 | #273 | Tragic 18.0% |
| Immigrants | Nigeria | 0.2 /100 | #274 | Tragic 18.0% |
| Immigrants | Laos | 0.2 /100 | #275 | Tragic 18.1% |
| Yuman | 0.2 /100 | #276 | Tragic 18.1% |
| Immigrants | Kuwait | 0.2 /100 | #277 | Tragic 18.1% |
| Immigrants | Micronesia | 0.2 /100 | #278 | Tragic 18.1% |
| Chippewa | 0.1 /100 | #279 | Tragic 18.1% |
| West Indians | 0.1 /100 | #280 | Tragic 18.1% |
| Yakama | 0.1 /100 | #281 | Tragic 18.1% |
| Immigrants | Cambodia | 0.1 /100 | #282 | Tragic 18.1% |
| Nigerians | 0.1 /100 | #283 | Tragic 18.1% |
Demographics Similar to Tsimshian by Cognitive Disability
In terms of cognitive disability, the demographic groups most similar to Tsimshian are Immigrants from Northern Africa (17.3%, a difference of 0.010%), Laotian (17.3%, a difference of 0.010%), Shoshone (17.3%, a difference of 0.020%), Ute (17.3%, a difference of 0.020%), and Spanish (17.3%, a difference of 0.020%).
| Demographics | Rating | Rank | Cognitive Disability |
| Immigrants | Immigrants | 62.5 /100 | #168 | Good 17.2% |
| Immigrants | Portugal | 61.8 /100 | #169 | Good 17.2% |
| Ecuadorians | 59.6 /100 | #170 | Average 17.2% |
| Tlingit-Haida | 59.4 /100 | #171 | Average 17.2% |
| Immigrants | Turkey | 56.7 /100 | #172 | Average 17.2% |
| Immigrants | Northern Africa | 50.2 /100 | #173 | Average 17.3% |
| Laotians | 50.0 /100 | #174 | Average 17.3% |
| Tsimshian | 49.8 /100 | #175 | Average 17.3% |
| Shoshone | 49.2 /100 | #176 | Average 17.3% |
| Ute | 49.1 /100 | #177 | Average 17.3% |
| Spanish | 48.9 /100 | #178 | Average 17.3% |
| Sioux | 48.6 /100 | #179 | Average 17.3% |
| Pakistanis | 43.9 /100 | #180 | Average 17.3% |
| Immigrants | Guyana | 42.9 /100 | #181 | Average 17.3% |
| Arabs | 42.8 /100 | #182 | Average 17.3% |