Yuman vs Albanian Cognitive Disability
COMPARE
Yuman
Albanian
Cognitive Disability
Cognitive Disability Comparison
Yuman
Albanians
18.1%
COGNITIVE DISABILITY
0.2/ 100
METRIC RATING
276th/ 347
METRIC RANK
16.8%
COGNITIVE DISABILITY
97.3/ 100
METRIC RATING
109th/ 347
METRIC RANK
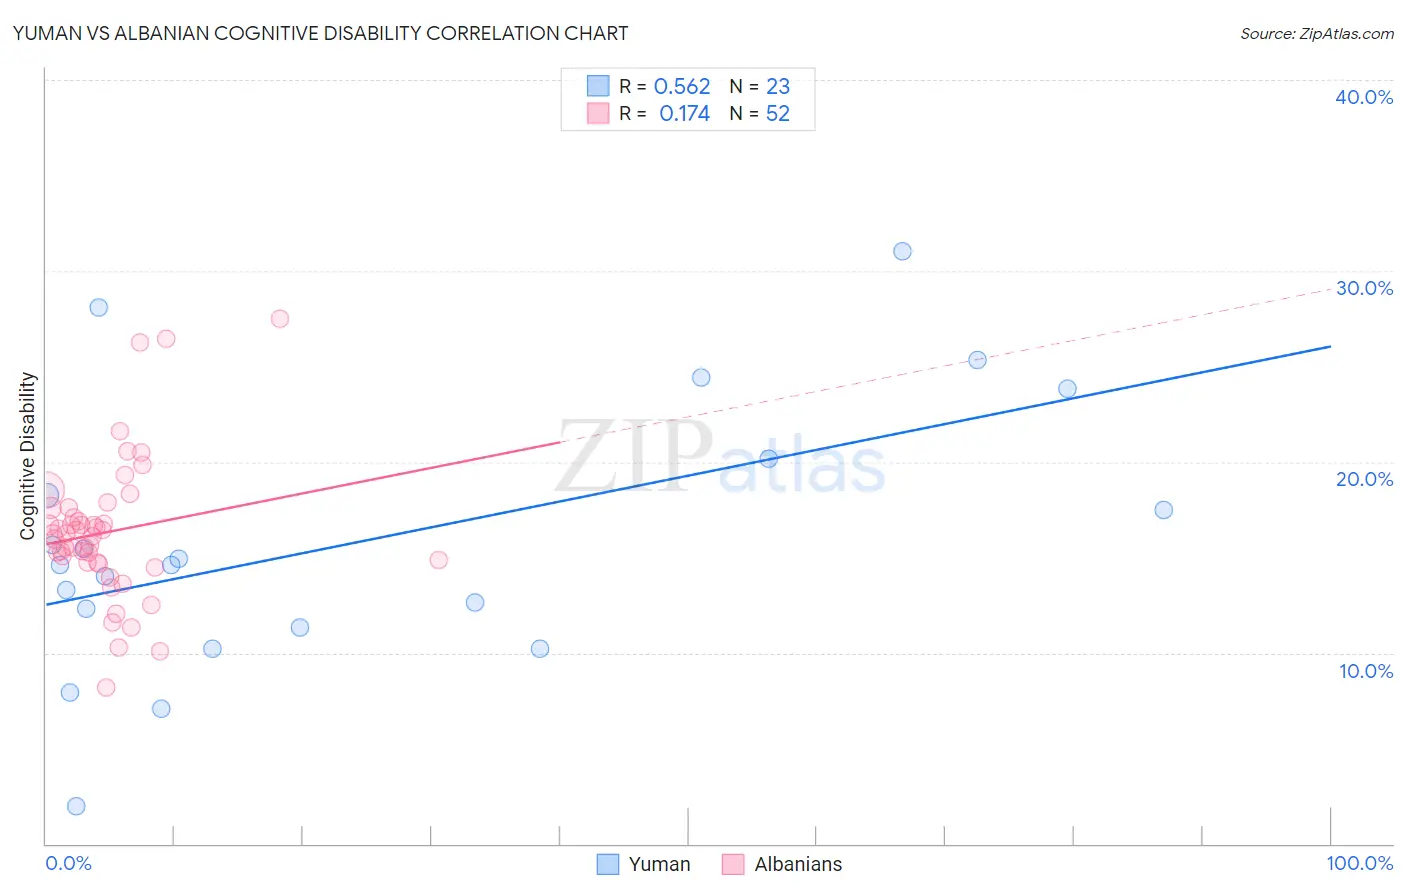
Yuman vs Albanian Cognitive Disability Correlation Chart
The statistical analysis conducted on geographies consisting of 40,663,643 people shows a substantial positive correlation between the proportion of Yuman and percentage of population with cognitive disability in the United States with a correlation coefficient (R) of 0.562 and weighted average of 18.1%. Similarly, the statistical analysis conducted on geographies consisting of 193,265,298 people shows a poor positive correlation between the proportion of Albanians and percentage of population with cognitive disability in the United States with a correlation coefficient (R) of 0.174 and weighted average of 16.8%, a difference of 7.3%.
Cognitive Disability Correlation Summary
| Measurement | Yuman | Albanian |
| Minimum | 1.9% | 8.2% |
| Maximum | 31.0% | 27.5% |
| Range | 29.1% | 19.3% |
| Mean | 15.9% | 16.3% |
| Median | 14.6% | 16.2% |
| Interquartile 25% (IQ1) | 11.3% | 14.7% |
| Interquartile 75% (IQ3) | 20.2% | 17.3% |
| Interquartile Range (IQR) | 8.9% | 2.6% |
| Standard Deviation (Sample) | 7.0% | 3.7% |
| Standard Deviation (Population) | 6.9% | 3.6% |
Similar Demographics by Cognitive Disability
Demographics Similar to Yuman by Cognitive Disability
In terms of cognitive disability, the demographic groups most similar to Yuman are Immigrants from Kuwait (18.1%, a difference of 0.0%), Immigrants from Micronesia (18.1%, a difference of 0.010%), Immigrants from Laos (18.1%, a difference of 0.040%), Chippewa (18.1%, a difference of 0.060%), and West Indian (18.1%, a difference of 0.070%).
| Demographics | Rating | Rank | Cognitive Disability |
| Hondurans | 0.3 /100 | #269 | Tragic 18.0% |
| Immigrants | Bahamas | 0.3 /100 | #270 | Tragic 18.0% |
| Potawatomi | 0.2 /100 | #271 | Tragic 18.0% |
| Immigrants | Honduras | 0.2 /100 | #272 | Tragic 18.0% |
| Immigrants | Nepal | 0.2 /100 | #273 | Tragic 18.0% |
| Immigrants | Nigeria | 0.2 /100 | #274 | Tragic 18.0% |
| Immigrants | Laos | 0.2 /100 | #275 | Tragic 18.1% |
| Yuman | 0.2 /100 | #276 | Tragic 18.1% |
| Immigrants | Kuwait | 0.2 /100 | #277 | Tragic 18.1% |
| Immigrants | Micronesia | 0.2 /100 | #278 | Tragic 18.1% |
| Chippewa | 0.1 /100 | #279 | Tragic 18.1% |
| West Indians | 0.1 /100 | #280 | Tragic 18.1% |
| Yakama | 0.1 /100 | #281 | Tragic 18.1% |
| Immigrants | Cambodia | 0.1 /100 | #282 | Tragic 18.1% |
| Nigerians | 0.1 /100 | #283 | Tragic 18.1% |
Demographics Similar to Albanians by Cognitive Disability
In terms of cognitive disability, the demographic groups most similar to Albanians are Arapaho (16.8%, a difference of 0.010%), Uruguayan (16.8%, a difference of 0.020%), Indian (Asian) (16.8%, a difference of 0.040%), Canadian (16.8%, a difference of 0.050%), and Immigrants from Sri Lanka (16.8%, a difference of 0.050%).
| Demographics | Rating | Rank | Cognitive Disability |
| Irish | 98.1 /100 | #102 | Exceptional 16.8% |
| Paraguayans | 98.0 /100 | #103 | Exceptional 16.8% |
| Palestinians | 98.0 /100 | #104 | Exceptional 16.8% |
| Immigrants | Eastern Asia | 97.9 /100 | #105 | Exceptional 16.8% |
| Northern Europeans | 97.8 /100 | #106 | Exceptional 16.8% |
| Immigrants | Nicaragua | 97.8 /100 | #107 | Exceptional 16.8% |
| Canadians | 97.5 /100 | #108 | Exceptional 16.8% |
| Albanians | 97.3 /100 | #109 | Exceptional 16.8% |
| Arapaho | 97.3 /100 | #110 | Exceptional 16.8% |
| Uruguayans | 97.2 /100 | #111 | Exceptional 16.8% |
| Indians (Asian) | 97.2 /100 | #112 | Exceptional 16.8% |
| Immigrants | Sri Lanka | 97.1 /100 | #113 | Exceptional 16.8% |
| Koreans | 97.1 /100 | #114 | Exceptional 16.8% |
| Yup'ik | 96.9 /100 | #115 | Exceptional 16.9% |
| Inupiat | 96.5 /100 | #116 | Exceptional 16.9% |