Blackfeet vs Tsimshian Cognitive Disability
COMPARE
Blackfeet
Tsimshian
Cognitive Disability
Cognitive Disability Comparison
Blackfeet
Tsimshian
18.3%
COGNITIVE DISABILITY
0.0/ 100
METRIC RATING
297th/ 347
METRIC RANK
17.3%
COGNITIVE DISABILITY
49.8/ 100
METRIC RATING
175th/ 347
METRIC RANK
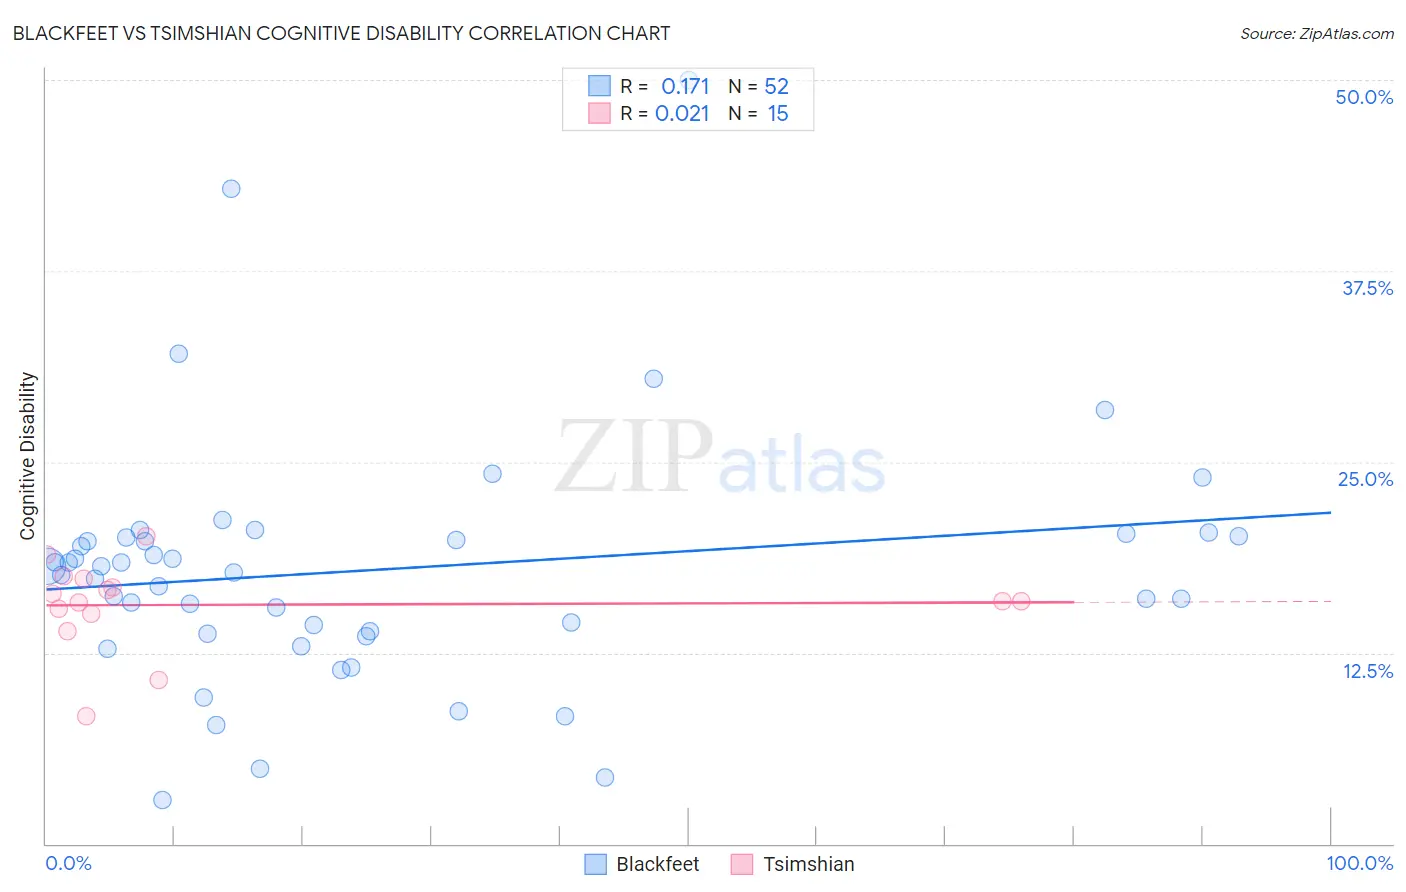
Blackfeet vs Tsimshian Cognitive Disability Correlation Chart
The statistical analysis conducted on geographies consisting of 309,516,270 people shows a poor positive correlation between the proportion of Blackfeet and percentage of population with cognitive disability in the United States with a correlation coefficient (R) of 0.171 and weighted average of 18.3%. Similarly, the statistical analysis conducted on geographies consisting of 15,626,544 people shows no correlation between the proportion of Tsimshian and percentage of population with cognitive disability in the United States with a correlation coefficient (R) of 0.021 and weighted average of 17.3%, a difference of 5.7%.
Cognitive Disability Correlation Summary
| Measurement | Blackfeet | Tsimshian |
| Minimum | 2.8% | 8.4% |
| Maximum | 50.0% | 20.1% |
| Range | 47.2% | 11.8% |
| Mean | 17.9% | 15.6% |
| Median | 18.0% | 15.9% |
| Interquartile 25% (IQ1) | 13.8% | 15.1% |
| Interquartile 75% (IQ3) | 20.1% | 17.3% |
| Interquartile Range (IQR) | 6.3% | 2.3% |
| Standard Deviation (Sample) | 8.2% | 2.9% |
| Standard Deviation (Population) | 8.1% | 2.8% |
Similar Demographics by Cognitive Disability
Demographics Similar to Blackfeet by Cognitive Disability
In terms of cognitive disability, the demographic groups most similar to Blackfeet are Japanese (18.3%, a difference of 0.0%), Ghanaian (18.3%, a difference of 0.040%), Creek (18.3%, a difference of 0.060%), Immigrants from Burma/Myanmar (18.2%, a difference of 0.14%), and German Russian (18.2%, a difference of 0.17%).
| Demographics | Rating | Rank | Cognitive Disability |
| Immigrants | Africa | 0.1 /100 | #290 | Tragic 18.1% |
| Ottawa | 0.1 /100 | #291 | Tragic 18.2% |
| Iroquois | 0.1 /100 | #292 | Tragic 18.2% |
| Central American Indians | 0.1 /100 | #293 | Tragic 18.2% |
| British West Indians | 0.1 /100 | #294 | Tragic 18.2% |
| German Russians | 0.0 /100 | #295 | Tragic 18.2% |
| Immigrants | Burma/Myanmar | 0.0 /100 | #296 | Tragic 18.2% |
| Blackfeet | 0.0 /100 | #297 | Tragic 18.3% |
| Japanese | 0.0 /100 | #298 | Tragic 18.3% |
| Ghanaians | 0.0 /100 | #299 | Tragic 18.3% |
| Creek | 0.0 /100 | #300 | Tragic 18.3% |
| Immigrants | Ghana | 0.0 /100 | #301 | Tragic 18.3% |
| Barbadians | 0.0 /100 | #302 | Tragic 18.3% |
| Immigrants | Kenya | 0.0 /100 | #303 | Tragic 18.3% |
| Immigrants | Eritrea | 0.0 /100 | #304 | Tragic 18.3% |
Demographics Similar to Tsimshian by Cognitive Disability
In terms of cognitive disability, the demographic groups most similar to Tsimshian are Immigrants from Northern Africa (17.3%, a difference of 0.010%), Laotian (17.3%, a difference of 0.010%), Shoshone (17.3%, a difference of 0.020%), Ute (17.3%, a difference of 0.020%), and Spanish (17.3%, a difference of 0.020%).
| Demographics | Rating | Rank | Cognitive Disability |
| Immigrants | Immigrants | 62.5 /100 | #168 | Good 17.2% |
| Immigrants | Portugal | 61.8 /100 | #169 | Good 17.2% |
| Ecuadorians | 59.6 /100 | #170 | Average 17.2% |
| Tlingit-Haida | 59.4 /100 | #171 | Average 17.2% |
| Immigrants | Turkey | 56.7 /100 | #172 | Average 17.2% |
| Immigrants | Northern Africa | 50.2 /100 | #173 | Average 17.3% |
| Laotians | 50.0 /100 | #174 | Average 17.3% |
| Tsimshian | 49.8 /100 | #175 | Average 17.3% |
| Shoshone | 49.2 /100 | #176 | Average 17.3% |
| Ute | 49.1 /100 | #177 | Average 17.3% |
| Spanish | 48.9 /100 | #178 | Average 17.3% |
| Sioux | 48.6 /100 | #179 | Average 17.3% |
| Pakistanis | 43.9 /100 | #180 | Average 17.3% |
| Immigrants | Guyana | 42.9 /100 | #181 | Average 17.3% |
| Arabs | 42.8 /100 | #182 | Average 17.3% |