Yuman vs Syrian Cognitive Disability
COMPARE
Yuman
Syrian
Cognitive Disability
Cognitive Disability Comparison
Yuman
Syrians
18.1%
COGNITIVE DISABILITY
0.2/ 100
METRIC RATING
276th/ 347
METRIC RANK
17.1%
COGNITIVE DISABILITY
83.0/ 100
METRIC RATING
151st/ 347
METRIC RANK
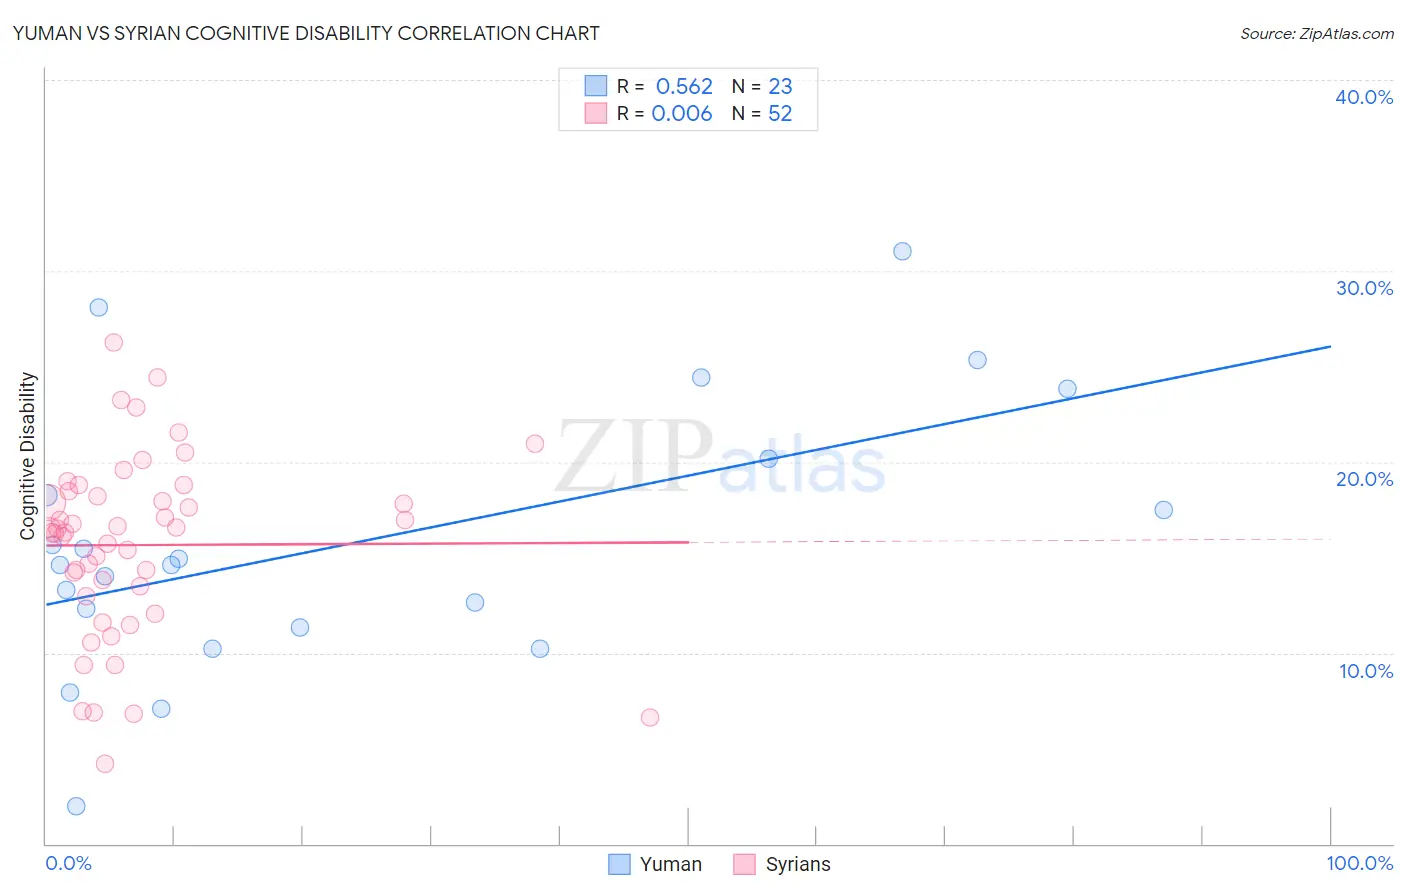
Yuman vs Syrian Cognitive Disability Correlation Chart
The statistical analysis conducted on geographies consisting of 40,663,643 people shows a substantial positive correlation between the proportion of Yuman and percentage of population with cognitive disability in the United States with a correlation coefficient (R) of 0.562 and weighted average of 18.1%. Similarly, the statistical analysis conducted on geographies consisting of 266,316,682 people shows no correlation between the proportion of Syrians and percentage of population with cognitive disability in the United States with a correlation coefficient (R) of 0.006 and weighted average of 17.1%, a difference of 5.8%.
Cognitive Disability Correlation Summary
| Measurement | Yuman | Syrian |
| Minimum | 1.9% | 4.2% |
| Maximum | 31.0% | 26.3% |
| Range | 29.1% | 22.0% |
| Mean | 15.9% | 15.6% |
| Median | 14.6% | 16.4% |
| Interquartile 25% (IQ1) | 11.3% | 13.2% |
| Interquartile 75% (IQ3) | 20.2% | 18.3% |
| Interquartile Range (IQR) | 8.9% | 5.1% |
| Standard Deviation (Sample) | 7.0% | 4.7% |
| Standard Deviation (Population) | 6.9% | 4.7% |
Similar Demographics by Cognitive Disability
Demographics Similar to Yuman by Cognitive Disability
In terms of cognitive disability, the demographic groups most similar to Yuman are Immigrants from Kuwait (18.1%, a difference of 0.0%), Immigrants from Micronesia (18.1%, a difference of 0.010%), Immigrants from Laos (18.1%, a difference of 0.040%), Chippewa (18.1%, a difference of 0.060%), and West Indian (18.1%, a difference of 0.070%).
| Demographics | Rating | Rank | Cognitive Disability |
| Hondurans | 0.3 /100 | #269 | Tragic 18.0% |
| Immigrants | Bahamas | 0.3 /100 | #270 | Tragic 18.0% |
| Potawatomi | 0.2 /100 | #271 | Tragic 18.0% |
| Immigrants | Honduras | 0.2 /100 | #272 | Tragic 18.0% |
| Immigrants | Nepal | 0.2 /100 | #273 | Tragic 18.0% |
| Immigrants | Nigeria | 0.2 /100 | #274 | Tragic 18.0% |
| Immigrants | Laos | 0.2 /100 | #275 | Tragic 18.1% |
| Yuman | 0.2 /100 | #276 | Tragic 18.1% |
| Immigrants | Kuwait | 0.2 /100 | #277 | Tragic 18.1% |
| Immigrants | Micronesia | 0.2 /100 | #278 | Tragic 18.1% |
| Chippewa | 0.1 /100 | #279 | Tragic 18.1% |
| West Indians | 0.1 /100 | #280 | Tragic 18.1% |
| Yakama | 0.1 /100 | #281 | Tragic 18.1% |
| Immigrants | Cambodia | 0.1 /100 | #282 | Tragic 18.1% |
| Nigerians | 0.1 /100 | #283 | Tragic 18.1% |
Demographics Similar to Syrians by Cognitive Disability
In terms of cognitive disability, the demographic groups most similar to Syrians are Immigrants from Indonesia (17.1%, a difference of 0.020%), Immigrants from Kazakhstan (17.1%, a difference of 0.12%), Basque (17.1%, a difference of 0.13%), French Canadian (17.1%, a difference of 0.15%), and Cypriot (17.1%, a difference of 0.15%).
| Demographics | Rating | Rank | Cognitive Disability |
| Immigrants | Brazil | 89.3 /100 | #144 | Excellent 17.0% |
| Immigrants | South Eastern Asia | 88.7 /100 | #145 | Excellent 17.0% |
| Costa Ricans | 88.0 /100 | #146 | Excellent 17.0% |
| Scotch-Irish | 85.9 /100 | #147 | Excellent 17.1% |
| French Canadians | 85.7 /100 | #148 | Excellent 17.1% |
| Cypriots | 85.7 /100 | #149 | Excellent 17.1% |
| Basques | 85.5 /100 | #150 | Excellent 17.1% |
| Syrians | 83.0 /100 | #151 | Excellent 17.1% |
| Immigrants | Indonesia | 82.7 /100 | #152 | Excellent 17.1% |
| Immigrants | Kazakhstan | 80.5 /100 | #153 | Excellent 17.1% |
| Immigrants | Malaysia | 79.3 /100 | #154 | Good 17.1% |
| Brazilians | 78.9 /100 | #155 | Good 17.1% |
| Sri Lankans | 78.9 /100 | #156 | Good 17.1% |
| Immigrants | Australia | 76.0 /100 | #157 | Good 17.1% |
| Celtics | 74.1 /100 | #158 | Good 17.1% |