Spanish American vs Puerto Rican Disability Age 65 to 74
COMPARE
Spanish American
Puerto Rican
Disability Age 65 to 74
Disability Age 65 to 74 Comparison
Spanish Americans
Puerto Ricans
25.9%
DISABILITY AGE 65 TO 74
0.0/ 100
METRIC RATING
283rd/ 347
METRIC RANK
29.1%
DISABILITY AGE 65 TO 74
0.0/ 100
METRIC RATING
323rd/ 347
METRIC RANK
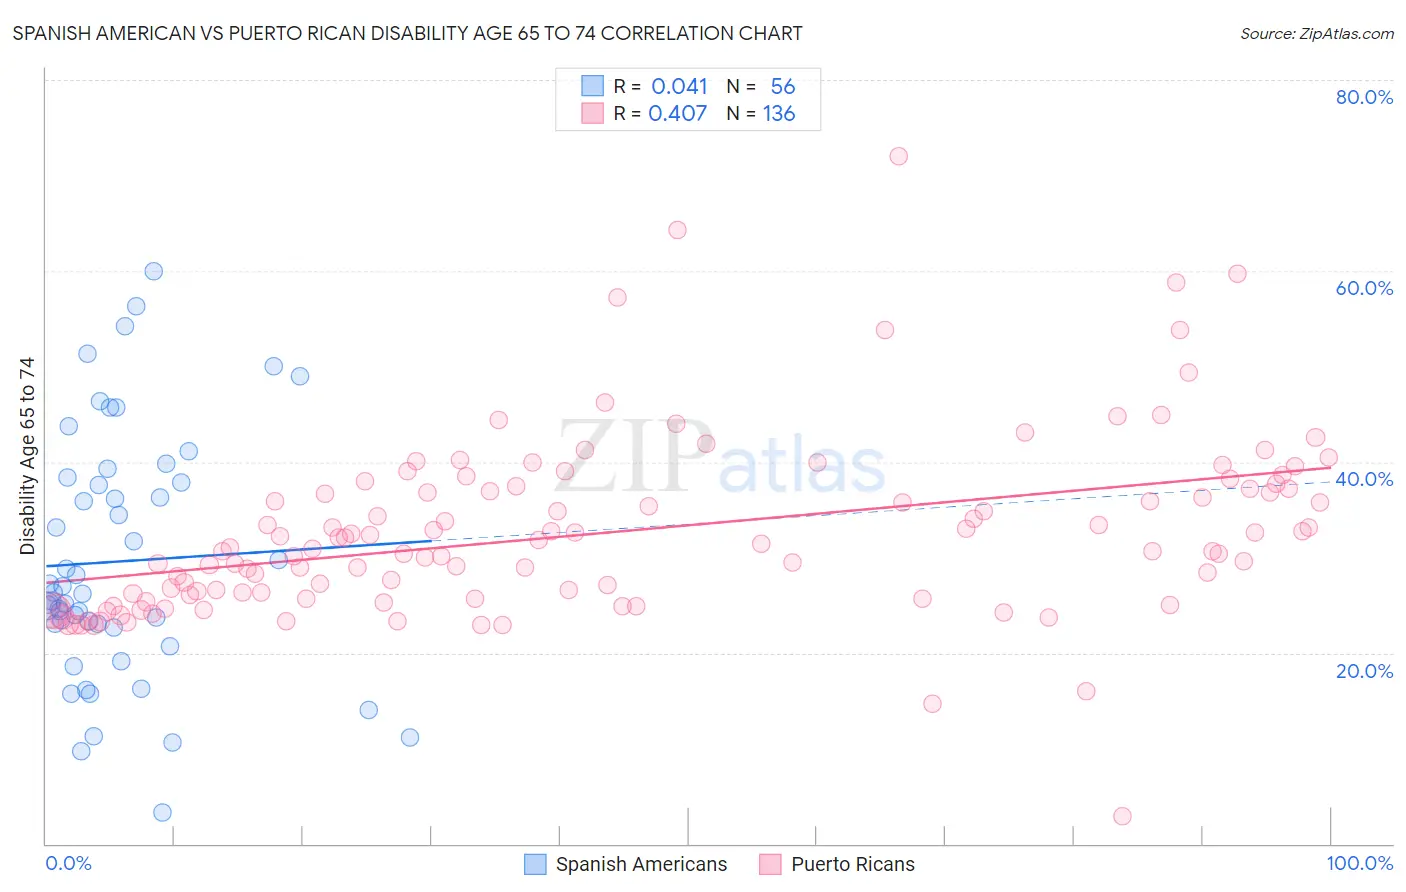
Spanish American vs Puerto Rican Disability Age 65 to 74 Correlation Chart
The statistical analysis conducted on geographies consisting of 103,158,709 people shows no correlation between the proportion of Spanish Americans and percentage of population with a disability between the ages 65 and 75 in the United States with a correlation coefficient (R) of 0.041 and weighted average of 25.9%. Similarly, the statistical analysis conducted on geographies consisting of 526,448,167 people shows a moderate positive correlation between the proportion of Puerto Ricans and percentage of population with a disability between the ages 65 and 75 in the United States with a correlation coefficient (R) of 0.407 and weighted average of 29.1%, a difference of 12.3%.
Disability Age 65 to 74 Correlation Summary
| Measurement | Spanish American | Puerto Rican |
| Minimum | 3.2% | 2.9% |
| Maximum | 60.0% | 72.0% |
| Range | 56.8% | 69.1% |
| Mean | 29.6% | 32.6% |
| Median | 26.3% | 31.0% |
| Interquartile 25% (IQ1) | 22.8% | 25.9% |
| Interquartile 75% (IQ3) | 38.1% | 37.2% |
| Interquartile Range (IQR) | 15.3% | 11.3% |
| Standard Deviation (Sample) | 12.9% | 9.5% |
| Standard Deviation (Population) | 12.8% | 9.5% |
Similar Demographics by Disability Age 65 to 74
Demographics Similar to Spanish Americans by Disability Age 65 to 74
In terms of disability age 65 to 74, the demographic groups most similar to Spanish Americans are Delaware (25.9%, a difference of 0.14%), Immigrants from the Azores (26.0%, a difference of 0.19%), Immigrants from Honduras (25.9%, a difference of 0.21%), Immigrants from Congo (26.0%, a difference of 0.21%), and Cree (25.9%, a difference of 0.24%).
| Demographics | Rating | Rank | Disability Age 65 to 74 |
| French American Indians | 0.1 /100 | #276 | Tragic 25.8% |
| Belizeans | 0.1 /100 | #277 | Tragic 25.8% |
| Immigrants | Belize | 0.1 /100 | #278 | Tragic 25.8% |
| U.S. Virgin Islanders | 0.1 /100 | #279 | Tragic 25.9% |
| Cree | 0.1 /100 | #280 | Tragic 25.9% |
| Immigrants | Honduras | 0.1 /100 | #281 | Tragic 25.9% |
| Delaware | 0.1 /100 | #282 | Tragic 25.9% |
| Spanish Americans | 0.0 /100 | #283 | Tragic 25.9% |
| Immigrants | Azores | 0.0 /100 | #284 | Tragic 26.0% |
| Immigrants | Congo | 0.0 /100 | #285 | Tragic 26.0% |
| Immigrants | Micronesia | 0.0 /100 | #286 | Tragic 26.1% |
| Immigrants | Laos | 0.0 /100 | #287 | Tragic 26.1% |
| Mexican American Indians | 0.0 /100 | #288 | Tragic 26.2% |
| Africans | 0.0 /100 | #289 | Tragic 26.2% |
| Immigrants | Cabo Verde | 0.0 /100 | #290 | Tragic 26.3% |
Demographics Similar to Puerto Ricans by Disability Age 65 to 74
In terms of disability age 65 to 74, the demographic groups most similar to Puerto Ricans are Seminole (29.4%, a difference of 0.97%), Dutch West Indian (29.6%, a difference of 1.4%), Yakama (29.6%, a difference of 1.7%), Apache (29.7%, a difference of 1.8%), and Aleut (28.4%, a difference of 2.5%).
| Demographics | Rating | Rank | Disability Age 65 to 74 |
| Crow | 0.0 /100 | #316 | Tragic 27.9% |
| Immigrants | Armenia | 0.0 /100 | #317 | Tragic 28.0% |
| Nepalese | 0.0 /100 | #318 | Tragic 28.0% |
| Arapaho | 0.0 /100 | #319 | Tragic 28.1% |
| Cherokee | 0.0 /100 | #320 | Tragic 28.2% |
| Comanche | 0.0 /100 | #321 | Tragic 28.3% |
| Aleuts | 0.0 /100 | #322 | Tragic 28.4% |
| Puerto Ricans | 0.0 /100 | #323 | Tragic 29.1% |
| Seminole | 0.0 /100 | #324 | Tragic 29.4% |
| Dutch West Indians | 0.0 /100 | #325 | Tragic 29.6% |
| Yakama | 0.0 /100 | #326 | Tragic 29.6% |
| Apache | 0.0 /100 | #327 | Tragic 29.7% |
| Hopi | 0.0 /100 | #328 | Tragic 30.0% |
| Choctaw | 0.0 /100 | #329 | Tragic 30.2% |
| Creek | 0.0 /100 | #330 | Tragic 30.2% |