Immigrants from Kazakhstan vs Puerto Rican Disability Age 65 to 74
COMPARE
Immigrants from Kazakhstan
Puerto Rican
Disability Age 65 to 74
Disability Age 65 to 74 Comparison
Immigrants from Kazakhstan
Puerto Ricans
22.4%
DISABILITY AGE 65 TO 74
93.9/ 100
METRIC RATING
120th/ 347
METRIC RANK
29.1%
DISABILITY AGE 65 TO 74
0.0/ 100
METRIC RATING
323rd/ 347
METRIC RANK
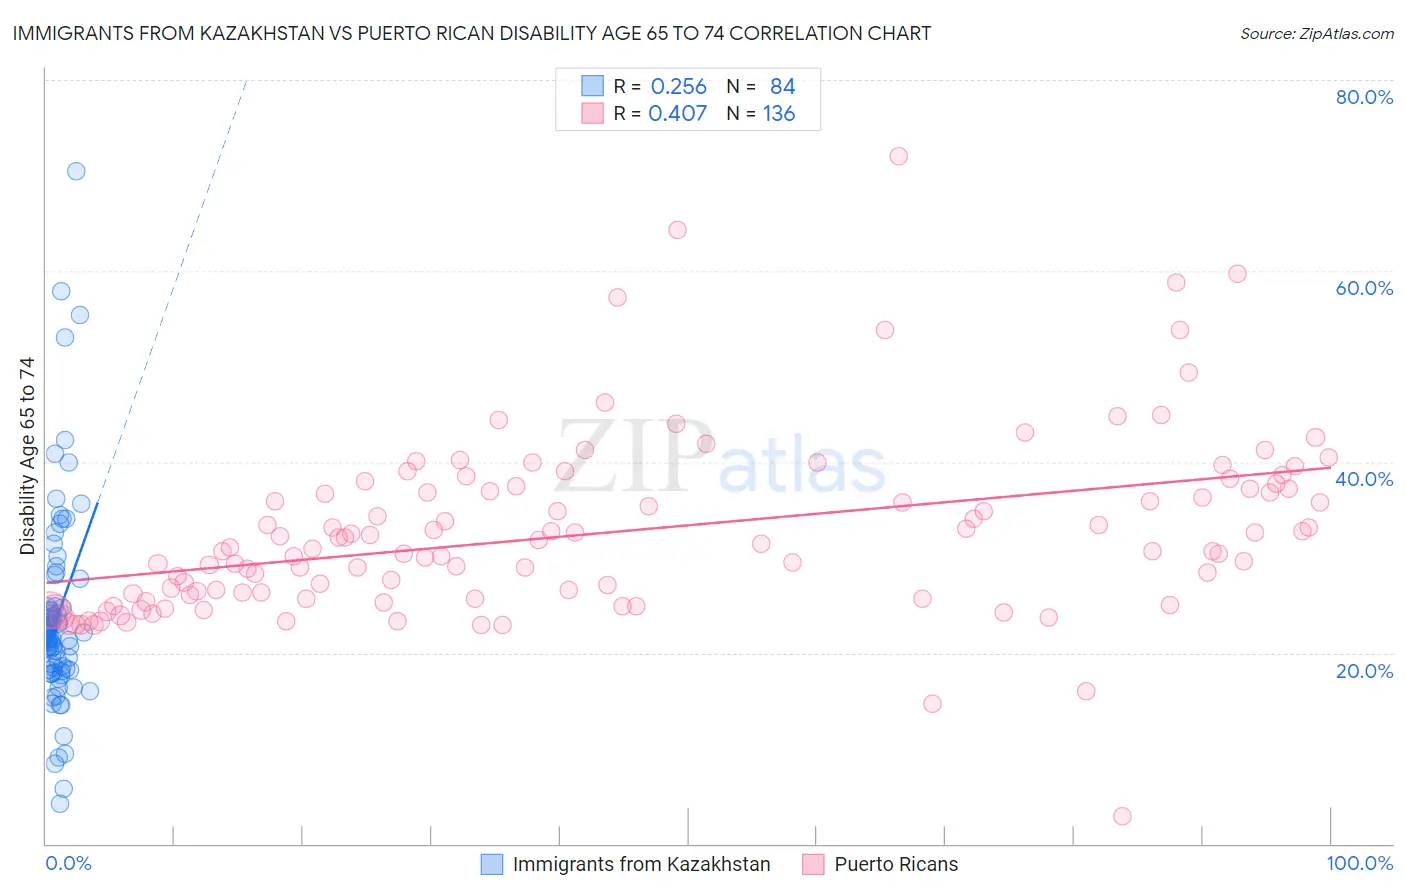
Immigrants from Kazakhstan vs Puerto Rican Disability Age 65 to 74 Correlation Chart
The statistical analysis conducted on geographies consisting of 124,413,271 people shows a weak positive correlation between the proportion of Immigrants from Kazakhstan and percentage of population with a disability between the ages 65 and 75 in the United States with a correlation coefficient (R) of 0.256 and weighted average of 22.4%. Similarly, the statistical analysis conducted on geographies consisting of 526,448,167 people shows a moderate positive correlation between the proportion of Puerto Ricans and percentage of population with a disability between the ages 65 and 75 in the United States with a correlation coefficient (R) of 0.407 and weighted average of 29.1%, a difference of 30.0%.
Disability Age 65 to 74 Correlation Summary
| Measurement | Immigrants from Kazakhstan | Puerto Rican |
| Minimum | 4.3% | 2.9% |
| Maximum | 70.4% | 72.0% |
| Range | 66.1% | 69.1% |
| Mean | 23.9% | 32.6% |
| Median | 21.8% | 31.0% |
| Interquartile 25% (IQ1) | 18.2% | 25.9% |
| Interquartile 75% (IQ3) | 24.8% | 37.2% |
| Interquartile Range (IQR) | 6.6% | 11.3% |
| Standard Deviation (Sample) | 10.8% | 9.5% |
| Standard Deviation (Population) | 10.8% | 9.5% |
Similar Demographics by Disability Age 65 to 74
Demographics Similar to Immigrants from Kazakhstan by Disability Age 65 to 74
In terms of disability age 65 to 74, the demographic groups most similar to Immigrants from Kazakhstan are Czech (22.4%, a difference of 0.10%), Immigrants from Jordan (22.4%, a difference of 0.10%), Hungarian (22.4%, a difference of 0.15%), Immigrants from Northern Africa (22.4%, a difference of 0.22%), and Swedish (22.4%, a difference of 0.23%).
| Demographics | Rating | Rank | Disability Age 65 to 74 |
| Syrians | 95.3 /100 | #113 | Exceptional 22.3% |
| Ukrainians | 95.1 /100 | #114 | Exceptional 22.3% |
| Laotians | 94.9 /100 | #115 | Exceptional 22.3% |
| Brazilians | 94.8 /100 | #116 | Exceptional 22.4% |
| Swedes | 94.7 /100 | #117 | Exceptional 22.4% |
| Austrians | 94.7 /100 | #118 | Exceptional 22.4% |
| Immigrants | Northern Africa | 94.7 /100 | #119 | Exceptional 22.4% |
| Immigrants | Kazakhstan | 93.9 /100 | #120 | Exceptional 22.4% |
| Czechs | 93.5 /100 | #121 | Exceptional 22.4% |
| Immigrants | Jordan | 93.5 /100 | #122 | Exceptional 22.4% |
| Hungarians | 93.3 /100 | #123 | Exceptional 22.4% |
| Norwegians | 92.5 /100 | #124 | Exceptional 22.5% |
| Immigrants | Western Europe | 92.3 /100 | #125 | Exceptional 22.5% |
| Lebanese | 92.2 /100 | #126 | Exceptional 22.5% |
| Slovaks | 91.6 /100 | #127 | Exceptional 22.5% |
Demographics Similar to Puerto Ricans by Disability Age 65 to 74
In terms of disability age 65 to 74, the demographic groups most similar to Puerto Ricans are Seminole (29.4%, a difference of 0.97%), Dutch West Indian (29.6%, a difference of 1.4%), Yakama (29.6%, a difference of 1.7%), Apache (29.7%, a difference of 1.8%), and Aleut (28.4%, a difference of 2.5%).
| Demographics | Rating | Rank | Disability Age 65 to 74 |
| Crow | 0.0 /100 | #316 | Tragic 27.9% |
| Immigrants | Armenia | 0.0 /100 | #317 | Tragic 28.0% |
| Nepalese | 0.0 /100 | #318 | Tragic 28.0% |
| Arapaho | 0.0 /100 | #319 | Tragic 28.1% |
| Cherokee | 0.0 /100 | #320 | Tragic 28.2% |
| Comanche | 0.0 /100 | #321 | Tragic 28.3% |
| Aleuts | 0.0 /100 | #322 | Tragic 28.4% |
| Puerto Ricans | 0.0 /100 | #323 | Tragic 29.1% |
| Seminole | 0.0 /100 | #324 | Tragic 29.4% |
| Dutch West Indians | 0.0 /100 | #325 | Tragic 29.6% |
| Yakama | 0.0 /100 | #326 | Tragic 29.6% |
| Apache | 0.0 /100 | #327 | Tragic 29.7% |
| Hopi | 0.0 /100 | #328 | Tragic 30.0% |
| Choctaw | 0.0 /100 | #329 | Tragic 30.2% |
| Creek | 0.0 /100 | #330 | Tragic 30.2% |