Yugoslavian vs Hispanic or Latino Disability Age 18 to 34
COMPARE
Yugoslavian
Hispanic or Latino
Disability Age 18 to 34
Disability Age 18 to 34 Comparison
Yugoslavians
Hispanics or Latinos
7.2%
DISABILITY AGE 18 TO 34
0.8/ 100
METRIC RATING
247th/ 347
METRIC RANK
6.8%
DISABILITY AGE 18 TO 34
13.8/ 100
METRIC RATING
203rd/ 347
METRIC RANK
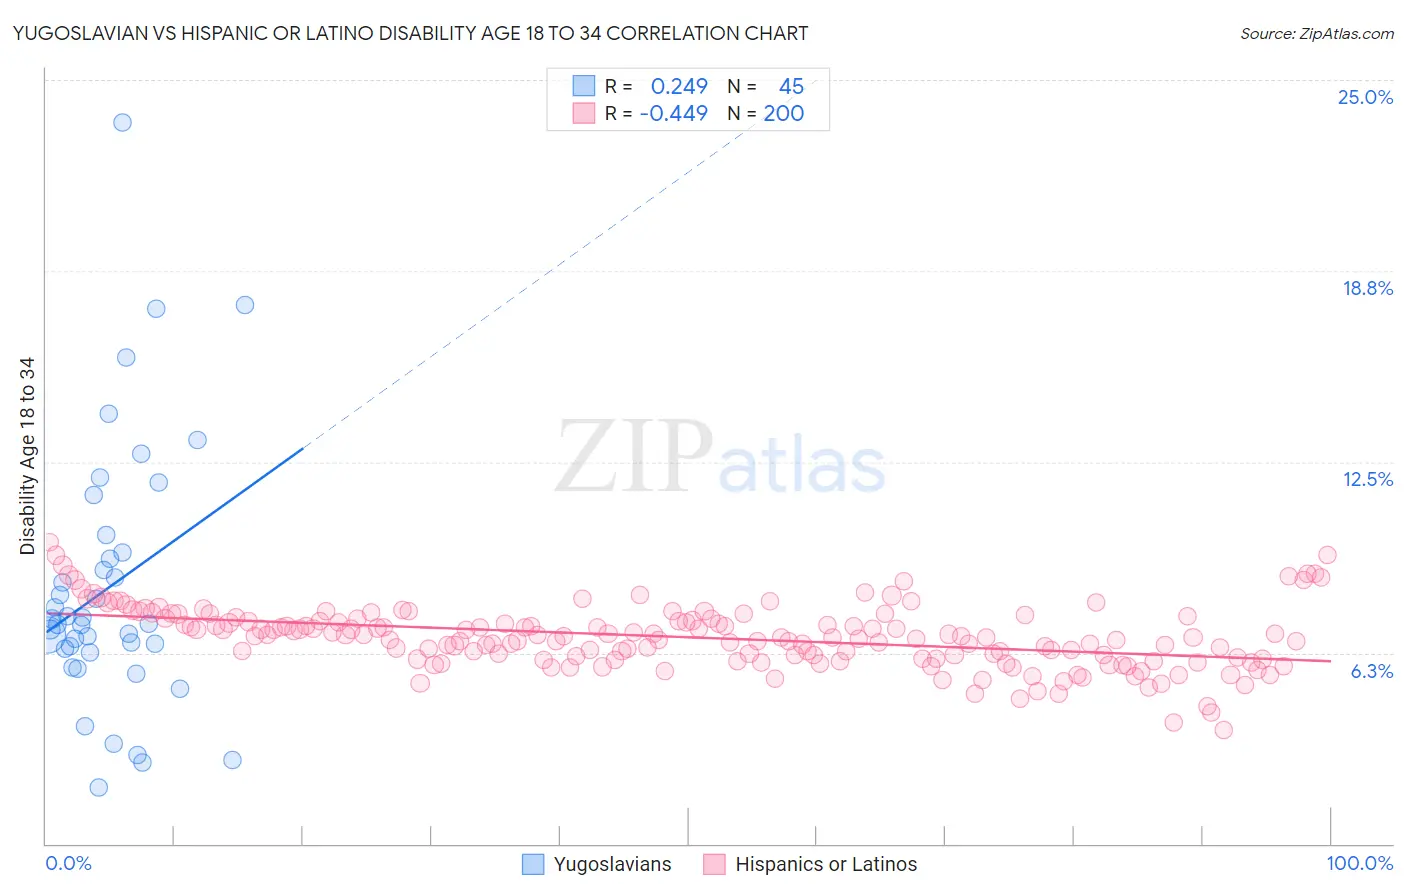
Yugoslavian vs Hispanic or Latino Disability Age 18 to 34 Correlation Chart
The statistical analysis conducted on geographies consisting of 285,257,895 people shows a weak positive correlation between the proportion of Yugoslavians and percentage of population with a disability between the ages 18 and 35 in the United States with a correlation coefficient (R) of 0.249 and weighted average of 7.2%. Similarly, the statistical analysis conducted on geographies consisting of 571,884,699 people shows a moderate negative correlation between the proportion of Hispanics or Latinos and percentage of population with a disability between the ages 18 and 35 in the United States with a correlation coefficient (R) of -0.449 and weighted average of 6.8%, a difference of 5.1%.
Disability Age 18 to 34 Correlation Summary
| Measurement | Yugoslavian | Hispanic or Latino |
| Minimum | 1.9% | 3.7% |
| Maximum | 23.6% | 9.9% |
| Range | 21.8% | 6.1% |
| Mean | 8.4% | 6.8% |
| Median | 7.2% | 6.8% |
| Interquartile 25% (IQ1) | 6.3% | 6.1% |
| Interquartile 75% (IQ3) | 9.8% | 7.3% |
| Interquartile Range (IQR) | 3.5% | 1.3% |
| Standard Deviation (Sample) | 4.3% | 1.0% |
| Standard Deviation (Population) | 4.3% | 1.0% |
Similar Demographics by Disability Age 18 to 34
Demographics Similar to Yugoslavians by Disability Age 18 to 34
In terms of disability age 18 to 34, the demographic groups most similar to Yugoslavians are Guamanian/Chamorro (7.2%, a difference of 0.040%), Malaysian (7.2%, a difference of 0.13%), Immigrants from Liberia (7.1%, a difference of 0.15%), Hungarian (7.1%, a difference of 0.17%), and Immigrants from Zaire (7.1%, a difference of 0.27%).
| Demographics | Rating | Rank | Disability Age 18 to 34 |
| Arapaho | 1.1 /100 | #240 | Tragic 7.1% |
| Nepalese | 1.1 /100 | #241 | Tragic 7.1% |
| Immigrants | Congo | 1.1 /100 | #242 | Tragic 7.1% |
| Icelanders | 1.0 /100 | #243 | Tragic 7.1% |
| Immigrants | Zaire | 0.9 /100 | #244 | Tragic 7.1% |
| Hungarians | 0.9 /100 | #245 | Tragic 7.1% |
| Immigrants | Liberia | 0.8 /100 | #246 | Tragic 7.1% |
| Yugoslavians | 0.8 /100 | #247 | Tragic 7.2% |
| Guamanians/Chamorros | 0.8 /100 | #248 | Tragic 7.2% |
| Malaysians | 0.7 /100 | #249 | Tragic 7.2% |
| Fijians | 0.6 /100 | #250 | Tragic 7.2% |
| Spaniards | 0.6 /100 | #251 | Tragic 7.2% |
| Poles | 0.6 /100 | #252 | Tragic 7.2% |
| Croatians | 0.5 /100 | #253 | Tragic 7.2% |
| Indonesians | 0.4 /100 | #254 | Tragic 7.2% |
Demographics Similar to Hispanics or Latinos by Disability Age 18 to 34
In terms of disability age 18 to 34, the demographic groups most similar to Hispanics or Latinos are Immigrants from Bosnia and Herzegovina (6.8%, a difference of 0.020%), Lebanese (6.8%, a difference of 0.080%), Japanese (6.8%, a difference of 0.15%), Mexican (6.8%, a difference of 0.18%), and Immigrants from Scotland (6.8%, a difference of 0.21%).
| Demographics | Rating | Rank | Disability Age 18 to 34 |
| Immigrants | Netherlands | 21.0 /100 | #196 | Fair 6.7% |
| Estonians | 20.6 /100 | #197 | Fair 6.8% |
| Australians | 19.4 /100 | #198 | Poor 6.8% |
| Kenyans | 18.3 /100 | #199 | Poor 6.8% |
| Sierra Leoneans | 17.5 /100 | #200 | Poor 6.8% |
| Greeks | 16.1 /100 | #201 | Poor 6.8% |
| Panamanians | 15.8 /100 | #202 | Poor 6.8% |
| Hispanics or Latinos | 13.8 /100 | #203 | Poor 6.8% |
| Immigrants | Bosnia and Herzegovina | 13.6 /100 | #204 | Poor 6.8% |
| Lebanese | 13.3 /100 | #205 | Poor 6.8% |
| Japanese | 12.8 /100 | #206 | Poor 6.8% |
| Mexicans | 12.6 /100 | #207 | Poor 6.8% |
| Immigrants | Scotland | 12.4 /100 | #208 | Poor 6.8% |
| Immigrants | Burma/Myanmar | 12.3 /100 | #209 | Poor 6.8% |
| Latvians | 11.1 /100 | #210 | Poor 6.8% |