Immigrants from Ghana vs Scandinavian Disability Age 18 to 34
COMPARE
Immigrants from Ghana
Scandinavian
Disability Age 18 to 34
Disability Age 18 to 34 Comparison
Immigrants from Ghana
Scandinavians
6.6%
DISABILITY AGE 18 TO 34
42.1/ 100
METRIC RATING
179th/ 347
METRIC RANK
7.7%
DISABILITY AGE 18 TO 34
0.0/ 100
METRIC RATING
293rd/ 347
METRIC RANK
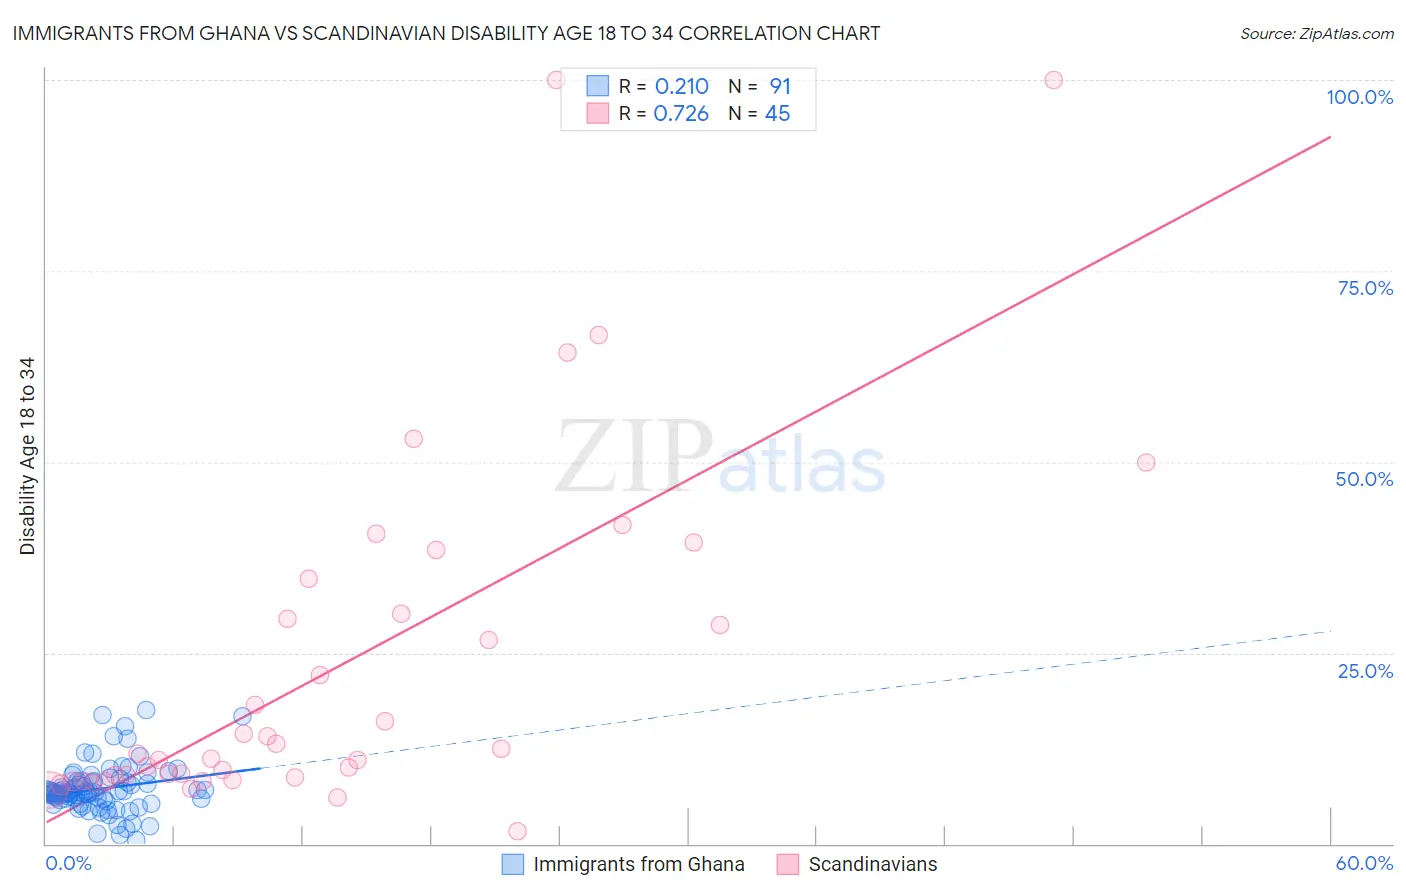
Immigrants from Ghana vs Scandinavian Disability Age 18 to 34 Correlation Chart
The statistical analysis conducted on geographies consisting of 199,825,304 people shows a weak positive correlation between the proportion of Immigrants from Ghana and percentage of population with a disability between the ages 18 and 35 in the United States with a correlation coefficient (R) of 0.210 and weighted average of 6.6%. Similarly, the statistical analysis conducted on geographies consisting of 470,294,545 people shows a strong positive correlation between the proportion of Scandinavians and percentage of population with a disability between the ages 18 and 35 in the United States with a correlation coefficient (R) of 0.726 and weighted average of 7.7%, a difference of 15.7%.
Disability Age 18 to 34 Correlation Summary
| Measurement | Immigrants from Ghana | Scandinavian |
| Minimum | 0.50% | 1.6% |
| Maximum | 17.4% | 100.0% |
| Range | 16.9% | 98.4% |
| Mean | 7.2% | 23.4% |
| Median | 6.7% | 11.8% |
| Interquartile 25% (IQ1) | 5.8% | 8.4% |
| Interquartile 75% (IQ3) | 8.2% | 32.4% |
| Interquartile Range (IQR) | 2.3% | 24.0% |
| Standard Deviation (Sample) | 3.2% | 23.3% |
| Standard Deviation (Population) | 3.1% | 23.0% |
Similar Demographics by Disability Age 18 to 34
Demographics Similar to Immigrants from Ghana by Disability Age 18 to 34
In terms of disability age 18 to 34, the demographic groups most similar to Immigrants from Ghana are Nigerian (6.6%, a difference of 0.11%), Syrian (6.6%, a difference of 0.15%), Immigrants from Austria (6.6%, a difference of 0.18%), Romanian (6.6%, a difference of 0.19%), and U.S. Virgin Islander (6.7%, a difference of 0.25%).
| Demographics | Rating | Rank | Disability Age 18 to 34 |
| Ghanaians | 54.7 /100 | #172 | Average 6.6% |
| Immigrants | Mexico | 54.1 /100 | #173 | Average 6.6% |
| Native Hawaiians | 50.0 /100 | #174 | Average 6.6% |
| Immigrants | Cambodia | 46.5 /100 | #175 | Average 6.6% |
| Immigrants | Africa | 45.9 /100 | #176 | Average 6.6% |
| Syrians | 44.3 /100 | #177 | Average 6.6% |
| Nigerians | 43.7 /100 | #178 | Average 6.6% |
| Immigrants | Ghana | 42.1 /100 | #179 | Average 6.6% |
| Immigrants | Austria | 39.6 /100 | #180 | Fair 6.6% |
| Romanians | 39.5 /100 | #181 | Fair 6.6% |
| U.S. Virgin Islanders | 38.6 /100 | #182 | Fair 6.7% |
| Immigrants | Iraq | 37.4 /100 | #183 | Fair 6.7% |
| Iraqis | 37.4 /100 | #184 | Fair 6.7% |
| Immigrants | Oceania | 35.4 /100 | #185 | Fair 6.7% |
| Yup'ik | 35.3 /100 | #186 | Fair 6.7% |
Demographics Similar to Scandinavians by Disability Age 18 to 34
In terms of disability age 18 to 34, the demographic groups most similar to Scandinavians are Black/African American (7.7%, a difference of 0.060%), Immigrants from Cabo Verde (7.7%, a difference of 0.15%), Tlingit-Haida (7.7%, a difference of 0.16%), Irish (7.7%, a difference of 0.28%), and Slovak (7.7%, a difference of 0.33%).
| Demographics | Rating | Rank | Disability Age 18 to 34 |
| Celtics | 0.0 /100 | #286 | Tragic 7.6% |
| Norwegians | 0.0 /100 | #287 | Tragic 7.6% |
| Whites/Caucasians | 0.0 /100 | #288 | Tragic 7.6% |
| Immigrants | Nonimmigrants | 0.0 /100 | #289 | Tragic 7.6% |
| Slovaks | 0.0 /100 | #290 | Tragic 7.7% |
| Irish | 0.0 /100 | #291 | Tragic 7.7% |
| Blacks/African Americans | 0.0 /100 | #292 | Tragic 7.7% |
| Scandinavians | 0.0 /100 | #293 | Tragic 7.7% |
| Immigrants | Cabo Verde | 0.0 /100 | #294 | Tragic 7.7% |
| Tlingit-Haida | 0.0 /100 | #295 | Tragic 7.7% |
| Cape Verdeans | 0.0 /100 | #296 | Tragic 7.7% |
| Pueblo | 0.0 /100 | #297 | Tragic 7.7% |
| Dutch | 0.0 /100 | #298 | Tragic 7.7% |
| Germans | 0.0 /100 | #299 | Tragic 7.7% |
| Scottish | 0.0 /100 | #300 | Tragic 7.7% |