Yugoslavian vs Immigrants from North America Disability Age 18 to 34
COMPARE
Yugoslavian
Immigrants from North America
Disability Age 18 to 34
Disability Age 18 to 34 Comparison
Yugoslavians
Immigrants from North America
7.2%
DISABILITY AGE 18 TO 34
0.8/ 100
METRIC RATING
247th/ 347
METRIC RANK
7.0%
DISABILITY AGE 18 TO 34
3.9/ 100
METRIC RATING
230th/ 347
METRIC RANK
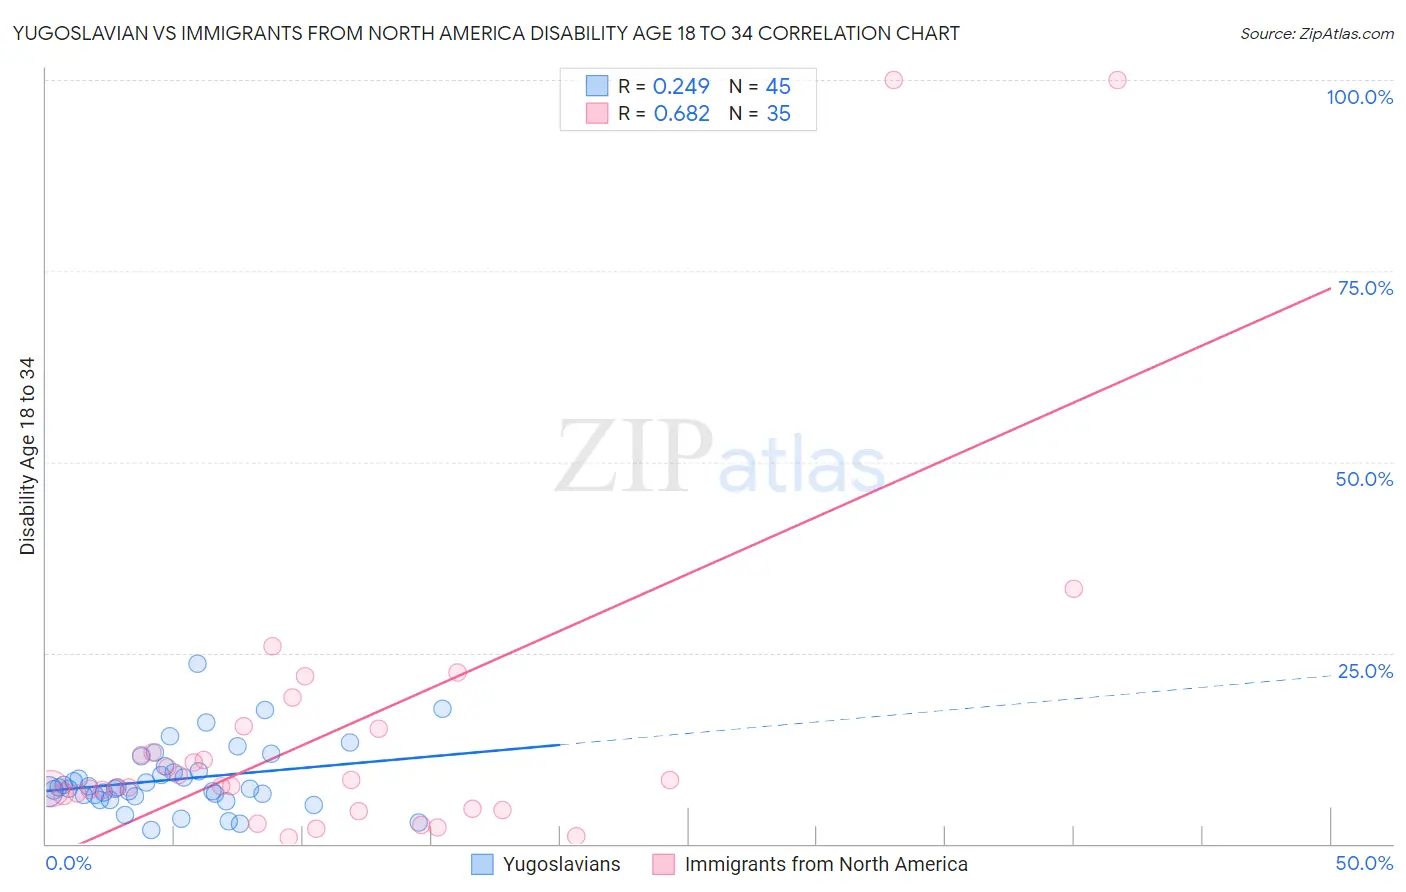
Yugoslavian vs Immigrants from North America Disability Age 18 to 34 Correlation Chart
The statistical analysis conducted on geographies consisting of 285,257,895 people shows a weak positive correlation between the proportion of Yugoslavians and percentage of population with a disability between the ages 18 and 35 in the United States with a correlation coefficient (R) of 0.249 and weighted average of 7.2%. Similarly, the statistical analysis conducted on geographies consisting of 460,575,007 people shows a significant positive correlation between the proportion of Immigrants from North America and percentage of population with a disability between the ages 18 and 35 in the United States with a correlation coefficient (R) of 0.682 and weighted average of 7.0%, a difference of 2.7%.
Disability Age 18 to 34 Correlation Summary
| Measurement | Yugoslavian | Immigrants from North America |
| Minimum | 1.9% | 0.83% |
| Maximum | 23.6% | 100.0% |
| Range | 21.8% | 99.2% |
| Mean | 8.4% | 14.9% |
| Median | 7.2% | 7.6% |
| Interquartile 25% (IQ1) | 6.3% | 4.5% |
| Interquartile 75% (IQ3) | 9.8% | 15.0% |
| Interquartile Range (IQR) | 3.5% | 10.5% |
| Standard Deviation (Sample) | 4.3% | 22.5% |
| Standard Deviation (Population) | 4.3% | 22.1% |
Demographics Similar to Yugoslavians and Immigrants from North America by Disability Age 18 to 34
In terms of disability age 18 to 34, the demographic groups most similar to Yugoslavians are Guamanian/Chamorro (7.2%, a difference of 0.040%), Immigrants from Liberia (7.1%, a difference of 0.15%), Hungarian (7.1%, a difference of 0.17%), Immigrants from Zaire (7.1%, a difference of 0.27%), and Icelander (7.1%, a difference of 0.48%). Similarly, the demographic groups most similar to Immigrants from North America are Ute (7.0%, a difference of 0.020%), Lithuanian (7.0%, a difference of 0.090%), Immigrants from Yemen (7.0%, a difference of 0.12%), Samoan (7.0%, a difference of 0.32%), and New Zealander (7.0%, a difference of 0.58%).
| Demographics | Rating | Rank | Disability Age 18 to 34 |
| Immigrants | Yemen | 4.2 /100 | #228 | Tragic 7.0% |
| Lithuanians | 4.1 /100 | #229 | Tragic 7.0% |
| Immigrants | North America | 3.9 /100 | #230 | Tragic 7.0% |
| Ute | 3.8 /100 | #231 | Tragic 7.0% |
| Samoans | 3.2 /100 | #232 | Tragic 7.0% |
| New Zealanders | 2.7 /100 | #233 | Tragic 7.0% |
| Alsatians | 2.1 /100 | #234 | Tragic 7.0% |
| Sub-Saharan Africans | 1.7 /100 | #235 | Tragic 7.1% |
| Liberians | 1.5 /100 | #236 | Tragic 7.1% |
| Austrians | 1.3 /100 | #237 | Tragic 7.1% |
| Marshallese | 1.3 /100 | #238 | Tragic 7.1% |
| Italians | 1.2 /100 | #239 | Tragic 7.1% |
| Arapaho | 1.1 /100 | #240 | Tragic 7.1% |
| Nepalese | 1.1 /100 | #241 | Tragic 7.1% |
| Immigrants | Congo | 1.1 /100 | #242 | Tragic 7.1% |
| Icelanders | 1.0 /100 | #243 | Tragic 7.1% |
| Immigrants | Zaire | 0.9 /100 | #244 | Tragic 7.1% |
| Hungarians | 0.9 /100 | #245 | Tragic 7.1% |
| Immigrants | Liberia | 0.8 /100 | #246 | Tragic 7.1% |
| Yugoslavians | 0.8 /100 | #247 | Tragic 7.2% |
| Guamanians/Chamorros | 0.8 /100 | #248 | Tragic 7.2% |